South Dakota's published statewide chronic-absence rate fell in every annual transition from 2022 through 2025. The rate moved from 21.6% to 20.3%, a decline of 1.3 percentage points across the four-year panel.
The remaining scale was still substantial. In 2025, 29,615 students met the definition out of a published statewide all-students total of 145,933. That ratio is 20.3%, or approximately one student in five.
District results covered a wide range. Among 148 districts with valid published all-students rates in 2025, the unweighted median was 12.3%, and 117 districts were below the 20.3% statewide rate.
Three steps in the same direction
The statewide rate declined in three consecutive annual transitions. It moved from 21.6% in 2022 to 21.2% in 2023, then 20.8% in 2024 and 20.3% in 2025.
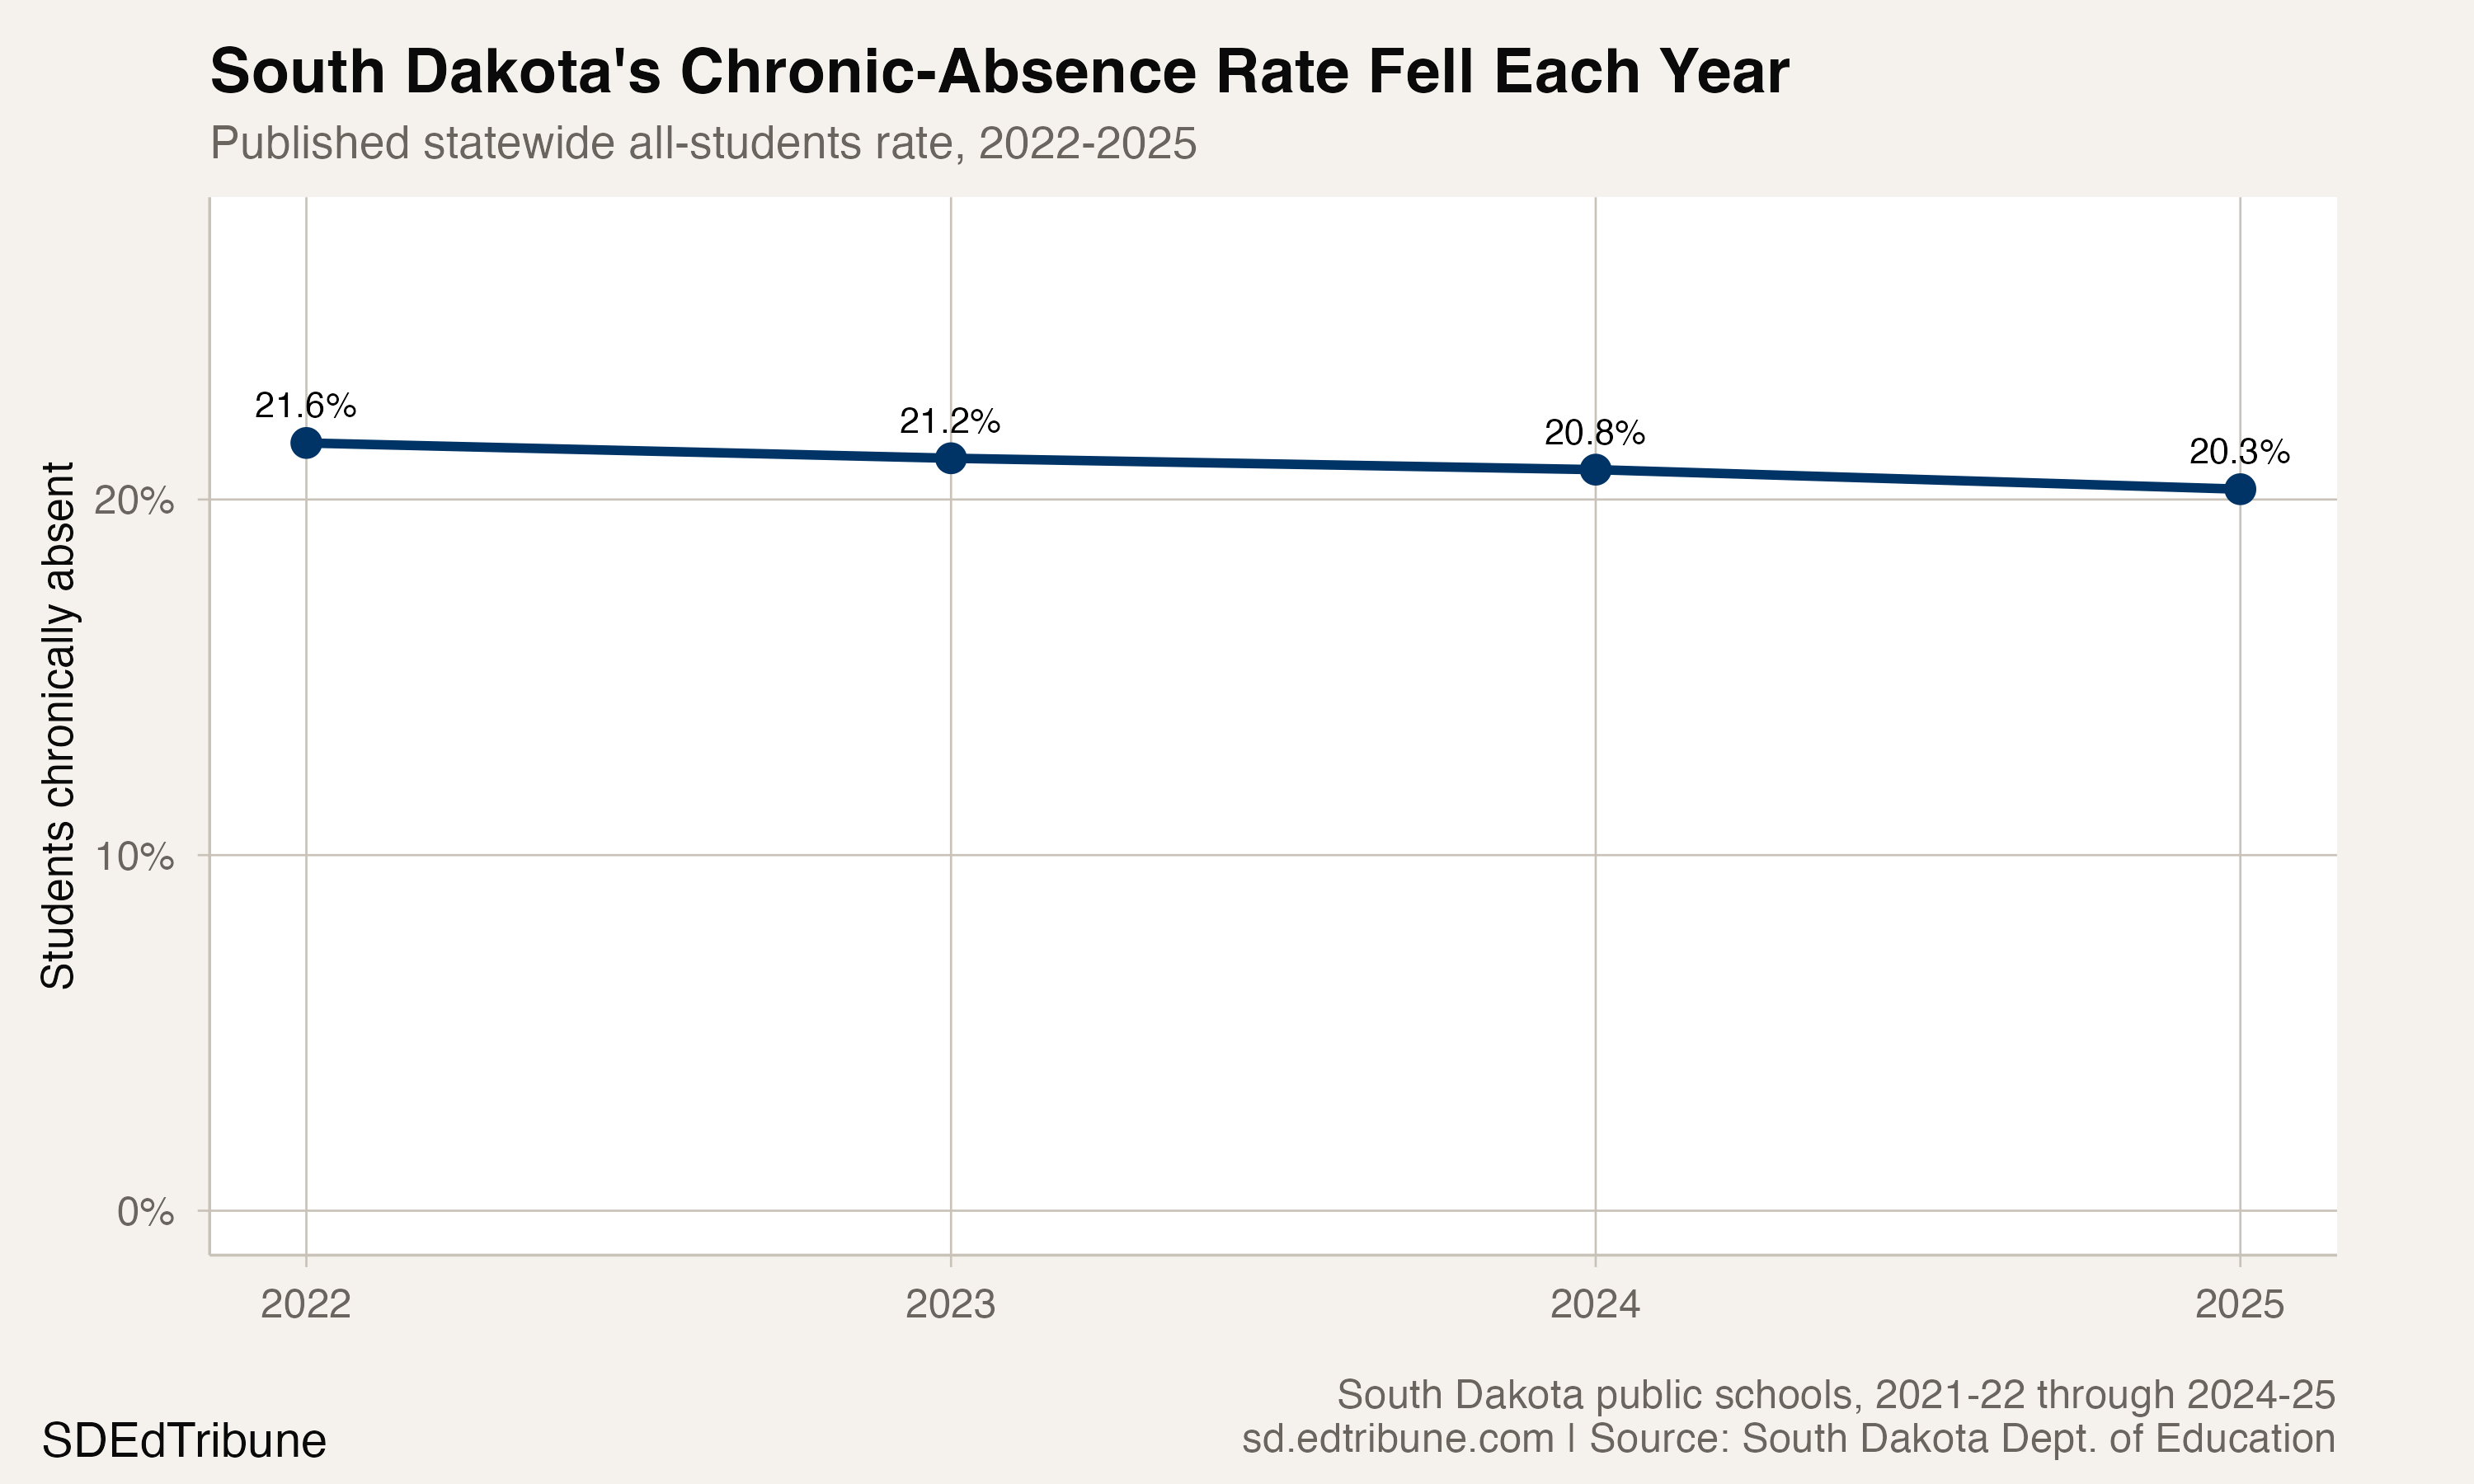
The verified panel contains four reporting years. It establishes the three-step decline within that window, but it cannot establish whether 2025 was low relative to earlier years outside the panel.
Fewer students crossed the threshold
The published number of students meeting the definition fell from 31,799 in 2022 to 29,615 in 2025, a reduction of 2,184 students.
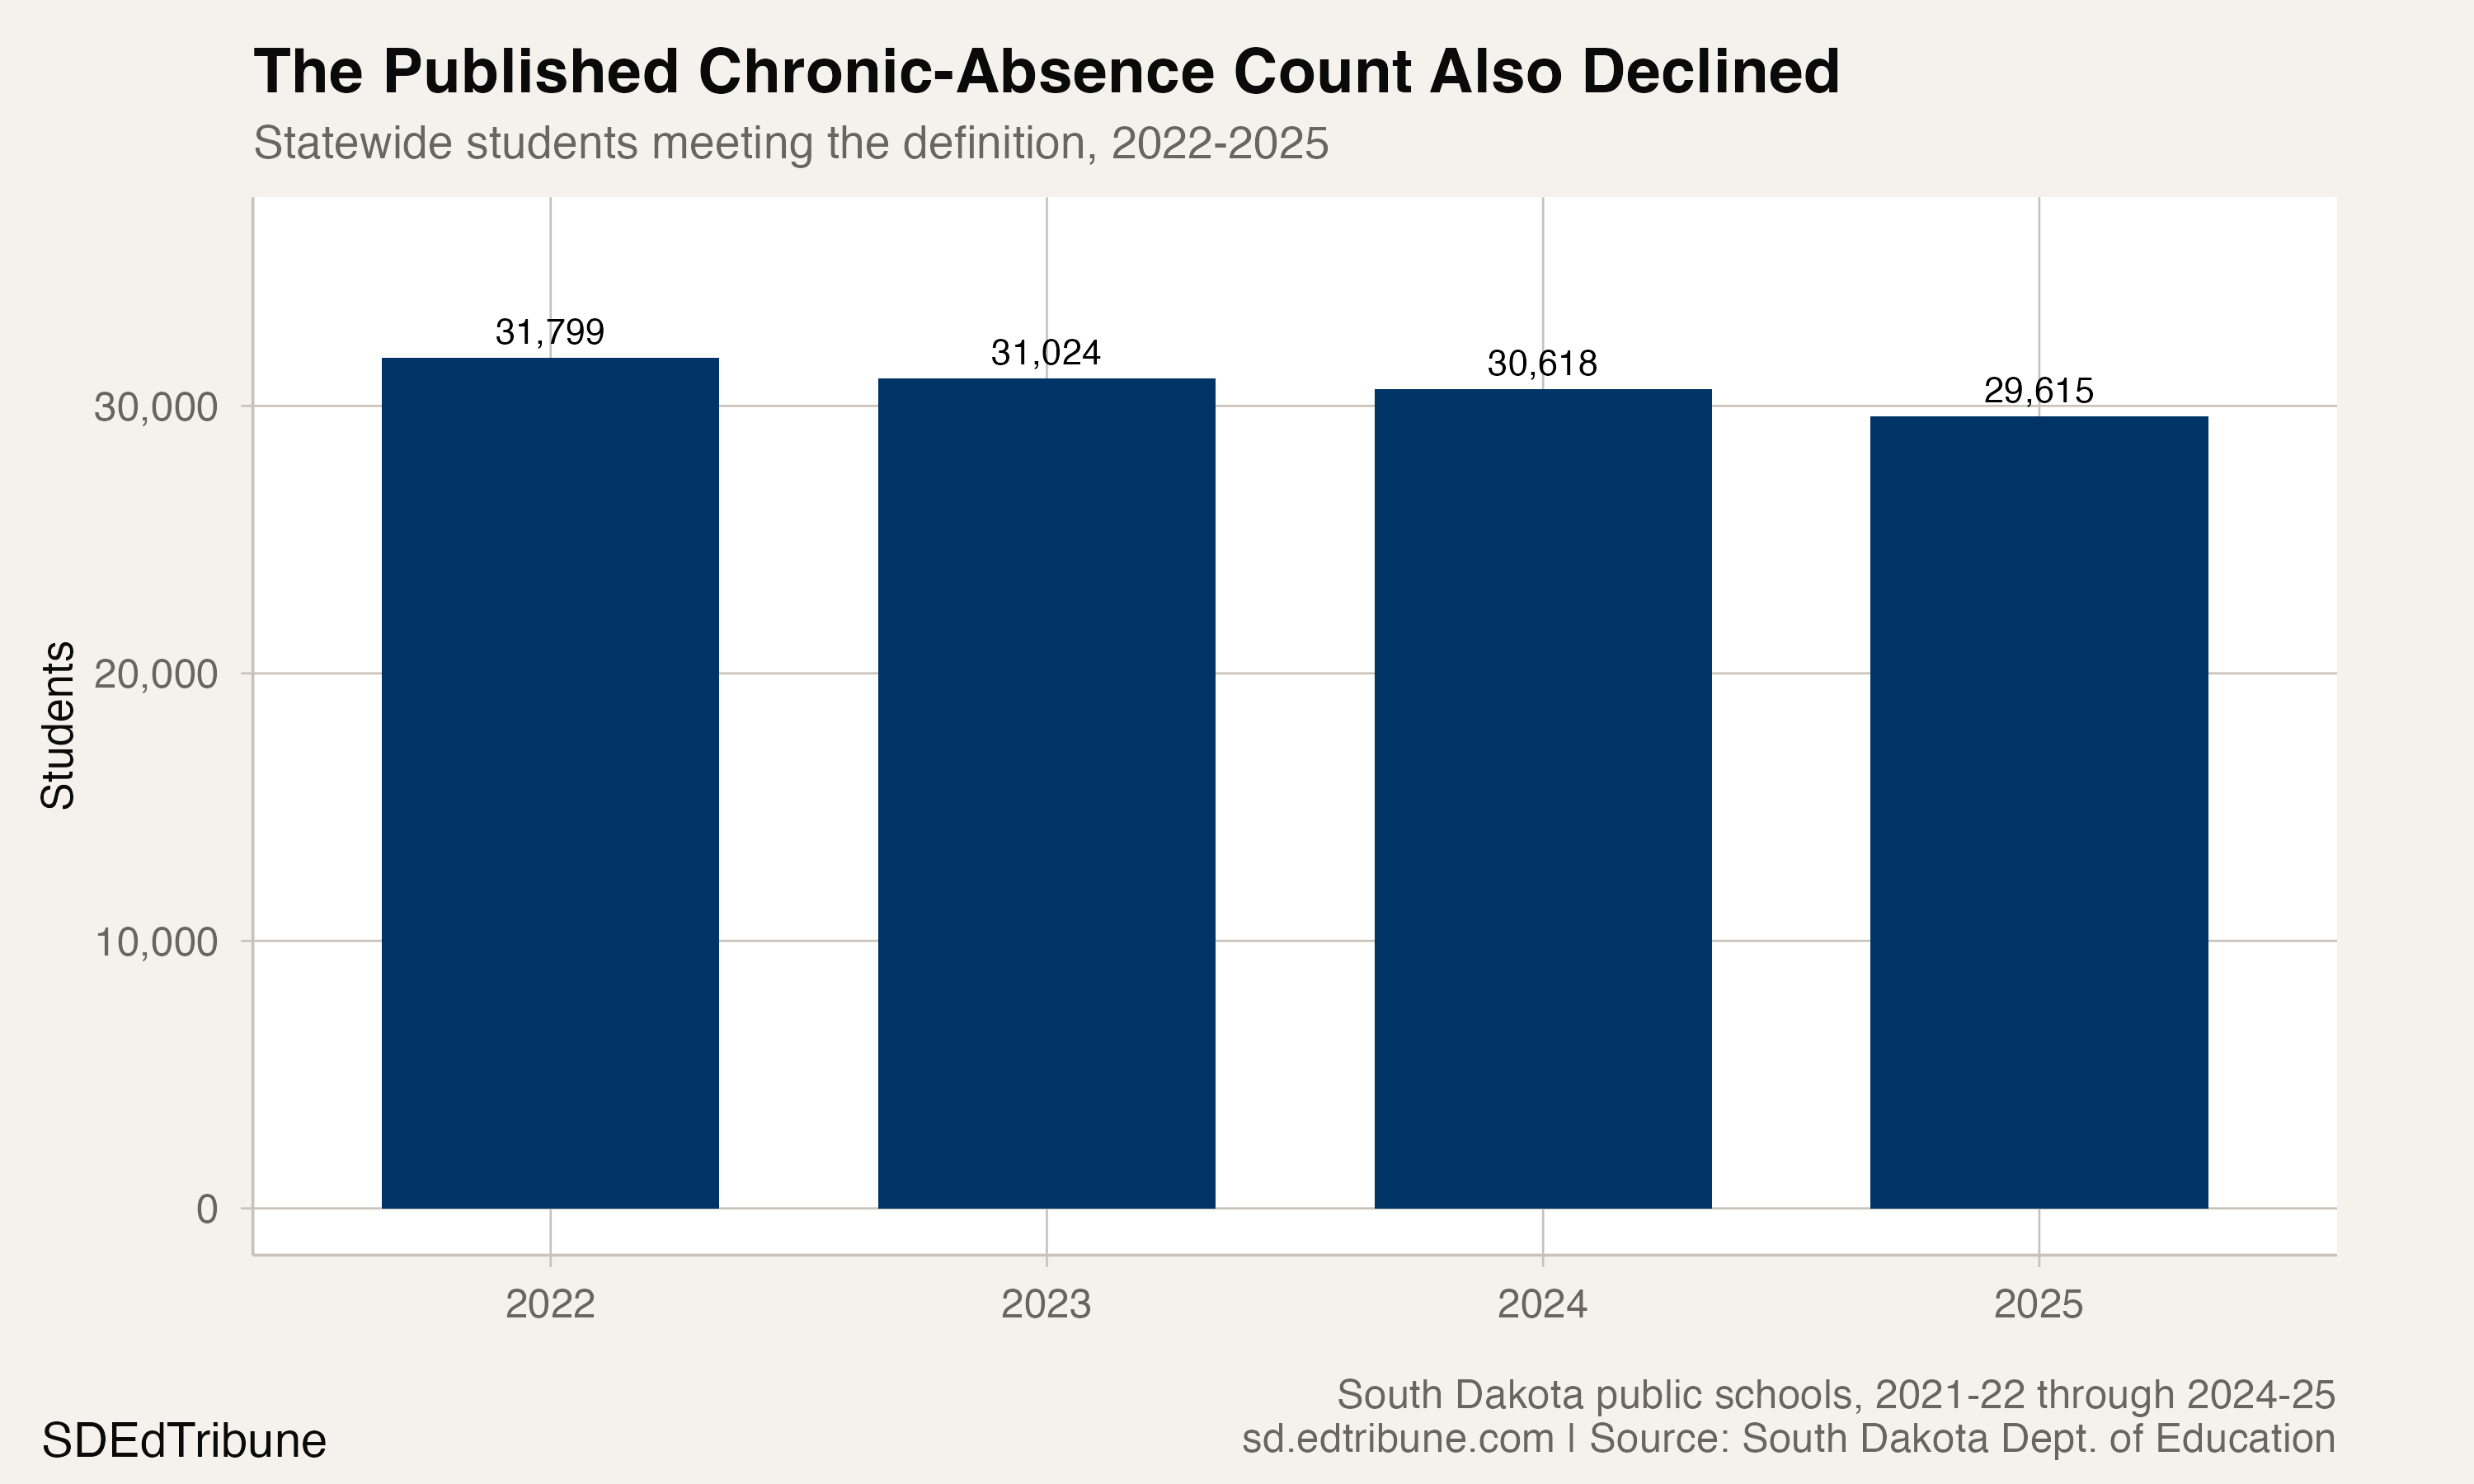
Published statewide enrollment also fell, from 147,264 students to 145,933, a reduction of 1,331. Because both the numerator and published denominator changed, the rate is the appropriate measure for comparing years.
The aggregate report-card rows describe the change; they do not identify its cause.
One state average, many district realities
The 2025 district distribution shows why a statewide rate cannot describe every community. Tea Area↗ET reported 205 chronically absent students among 2,627 students, for a published rate of 7.8%. Todd County↗ET reported 1,640 among 2,275, for 72.1%, the highest published rate among all 148 districts in the verified universe.
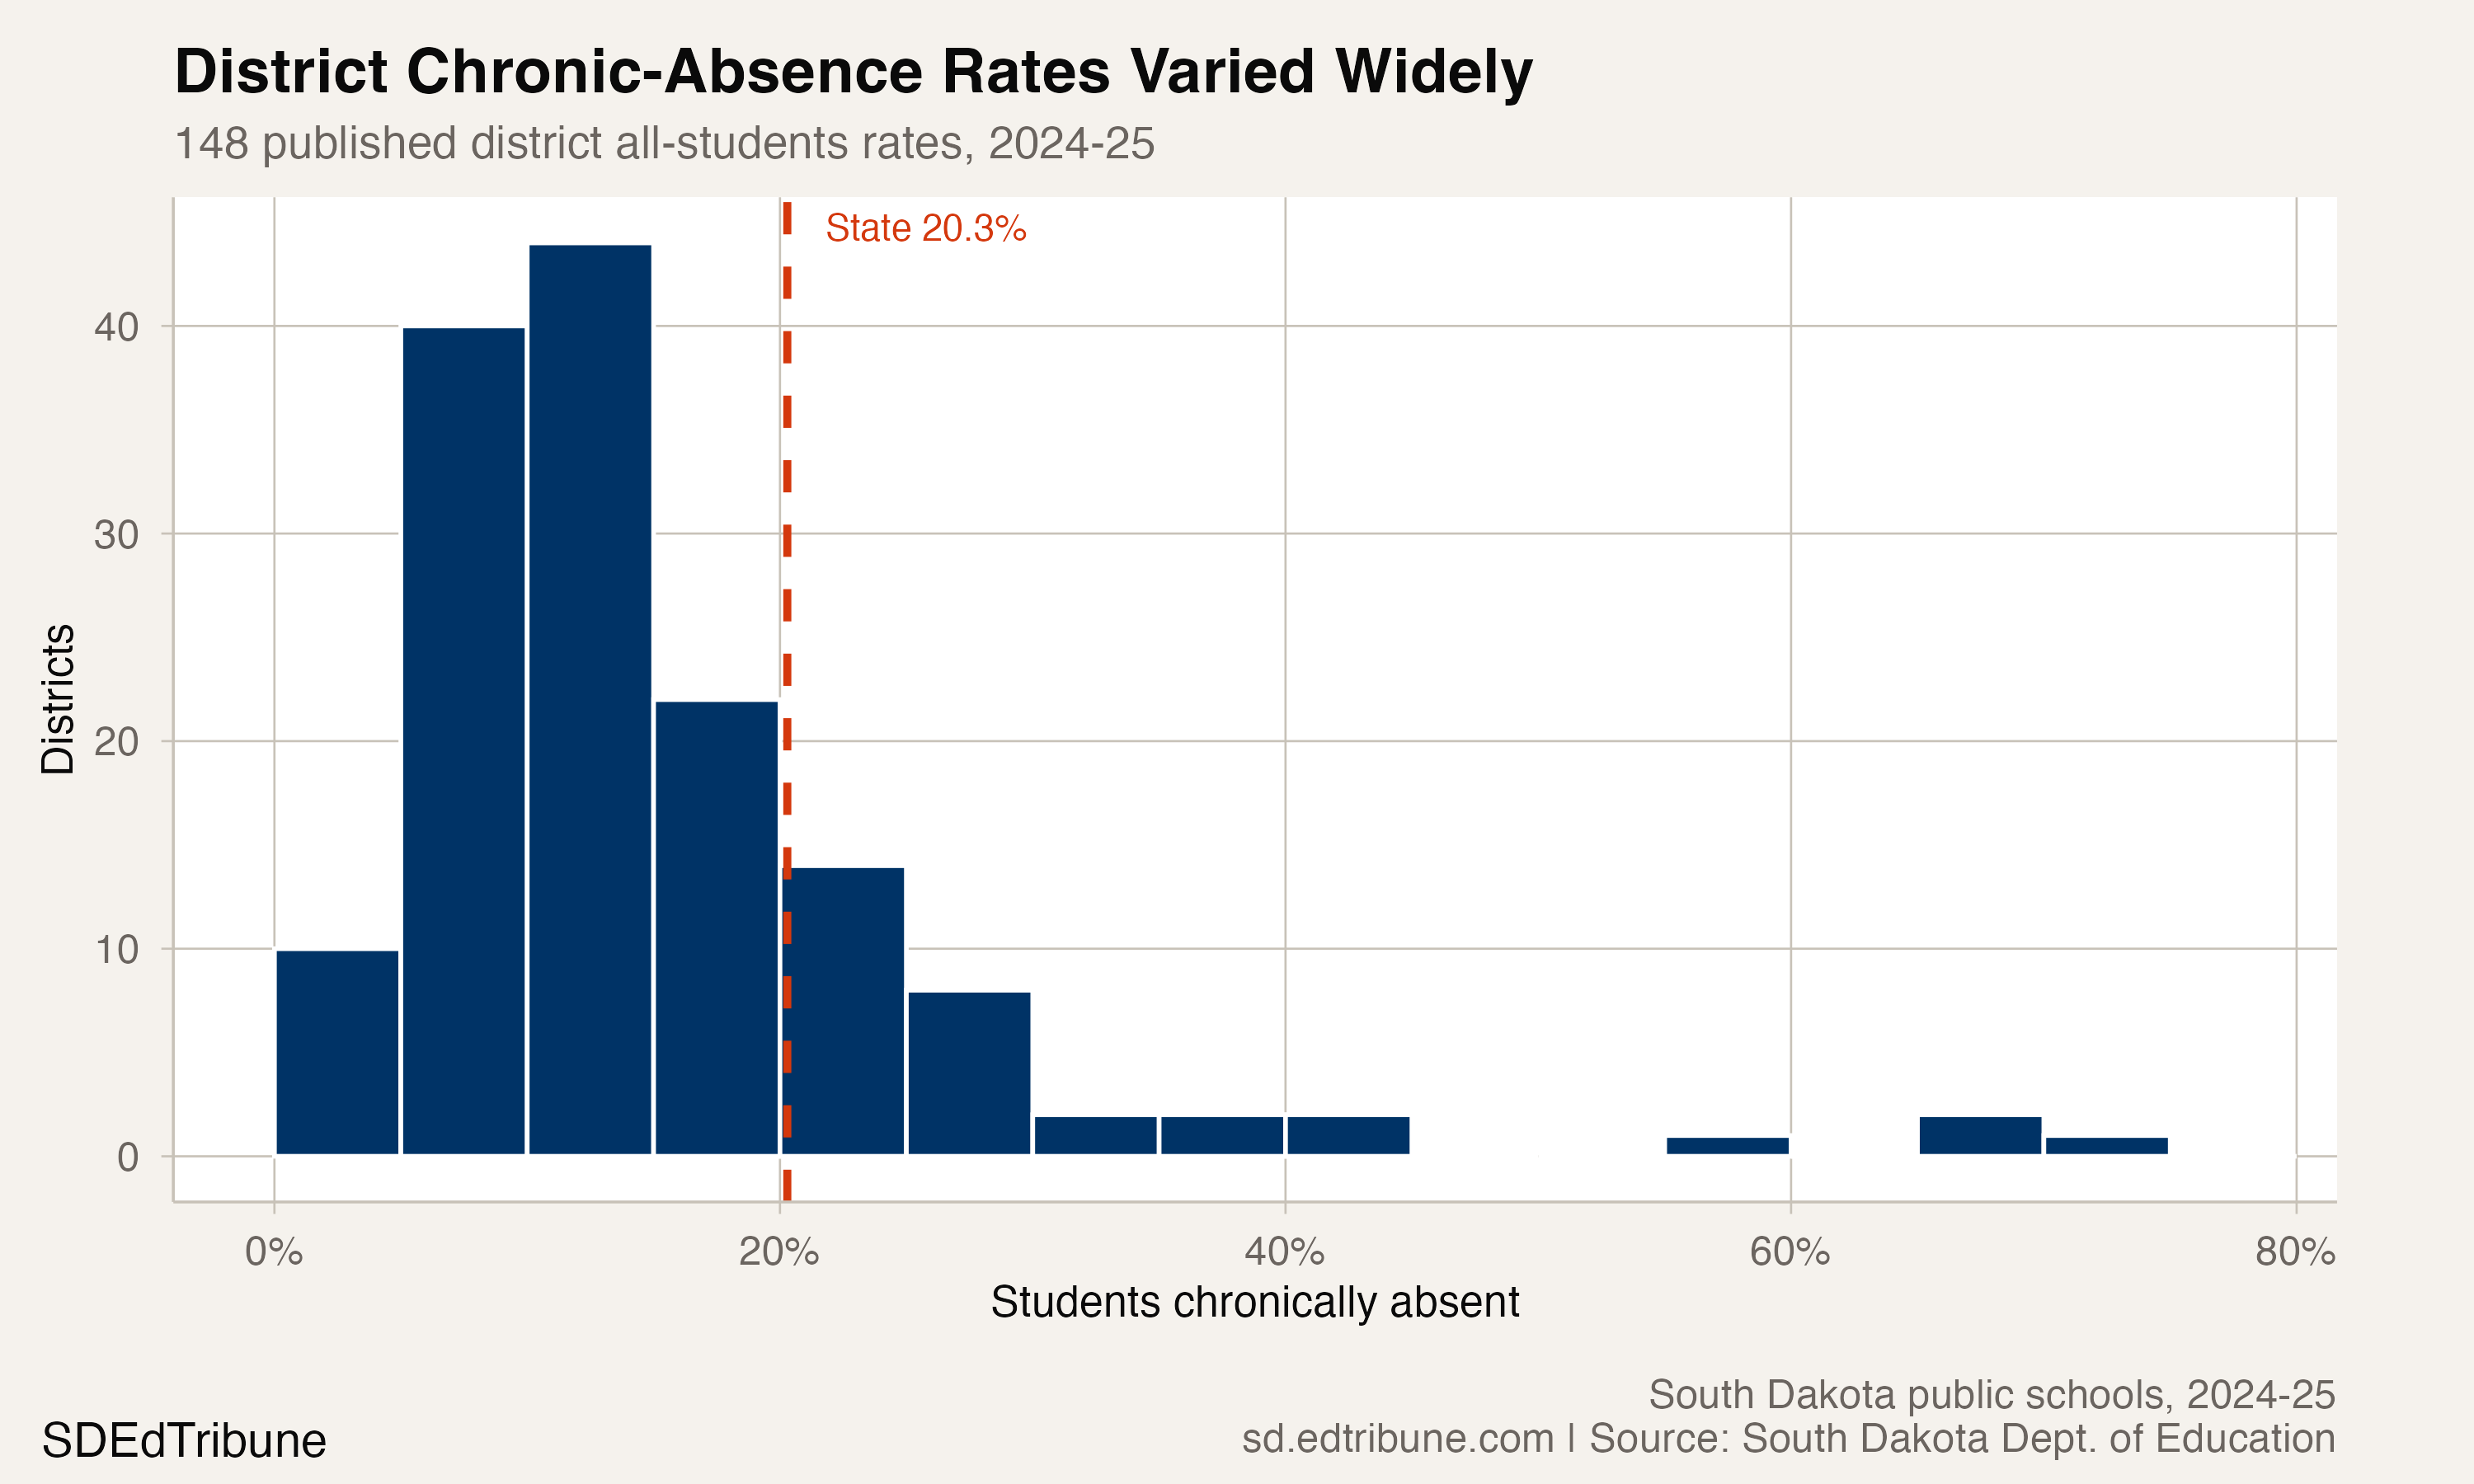
Among the 25 districts with at least 1,000 students in 2025, Tea Area had the second-lowest chronic-absence rate and Todd County had the highest. That comparison is limited to the stated enrollment threshold; smaller districts are included in the 148-district distribution but not in this large-district ranking.
The report-card data locate the differences. They do not explain what produced them.
Detailed code that reproduces the analysis and figures in this article is available exclusively to EdTribune subscribers.
Discussion
Sign in to join the discussion.
Loading comments...