South Dakota's female chronic-absence rate exceeded its male rate in every reporting year from 2022 through 2025, even as both declined.
A separate attendance gap for students with disabilities moved differently. It narrowed for two years, then more than doubled in 2025. The state file does not cross-tabulate gender and disability status, so the patterns cannot be linked to each other.
Both gender rates fell, but the gap persisted
The female chronic-absence rate moved from 22.3% in 2022 to 21.9%, 21.5% and 20.9% in the next three years. The male rate followed a parallel path, moving from 20.9% to 20.5%, 20.2% and 19.7%.
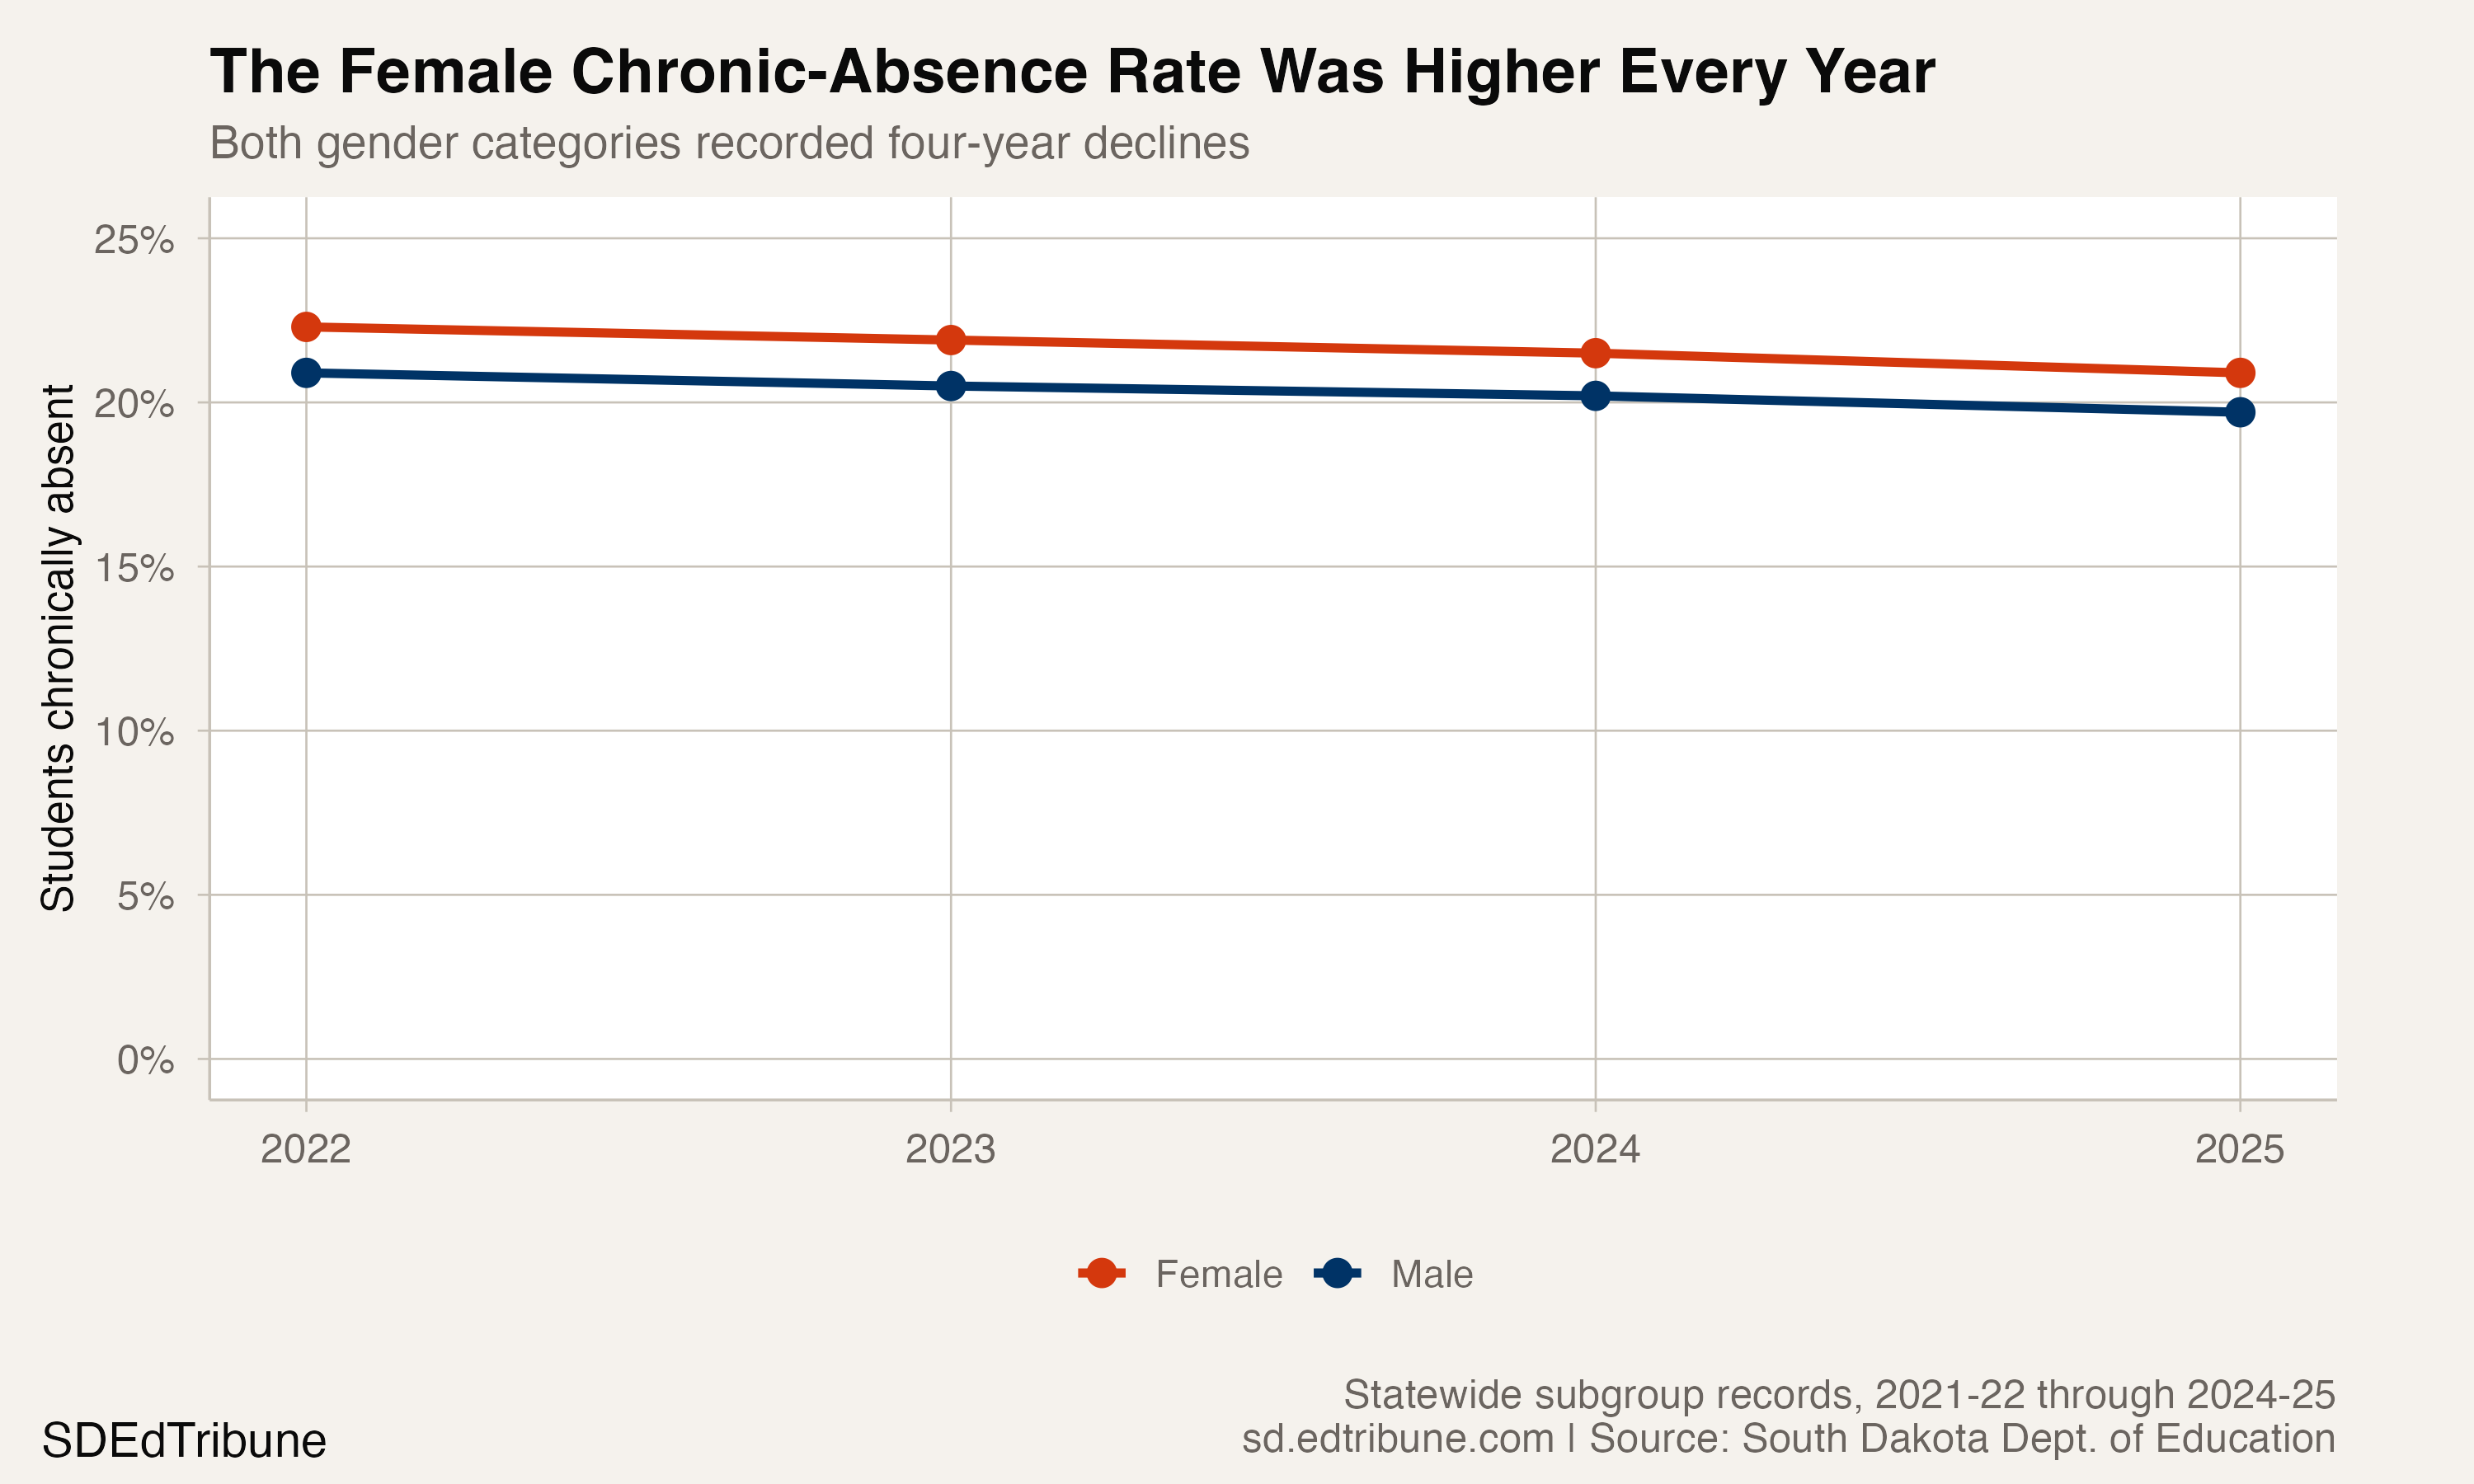
Across the full panel, the female rate fell 1.4 points and the female chronic count declined by 1,138. The male rate fell 1.2 points and the male chronic count declined by 1,046. Both categories improved even though the rate difference remained.
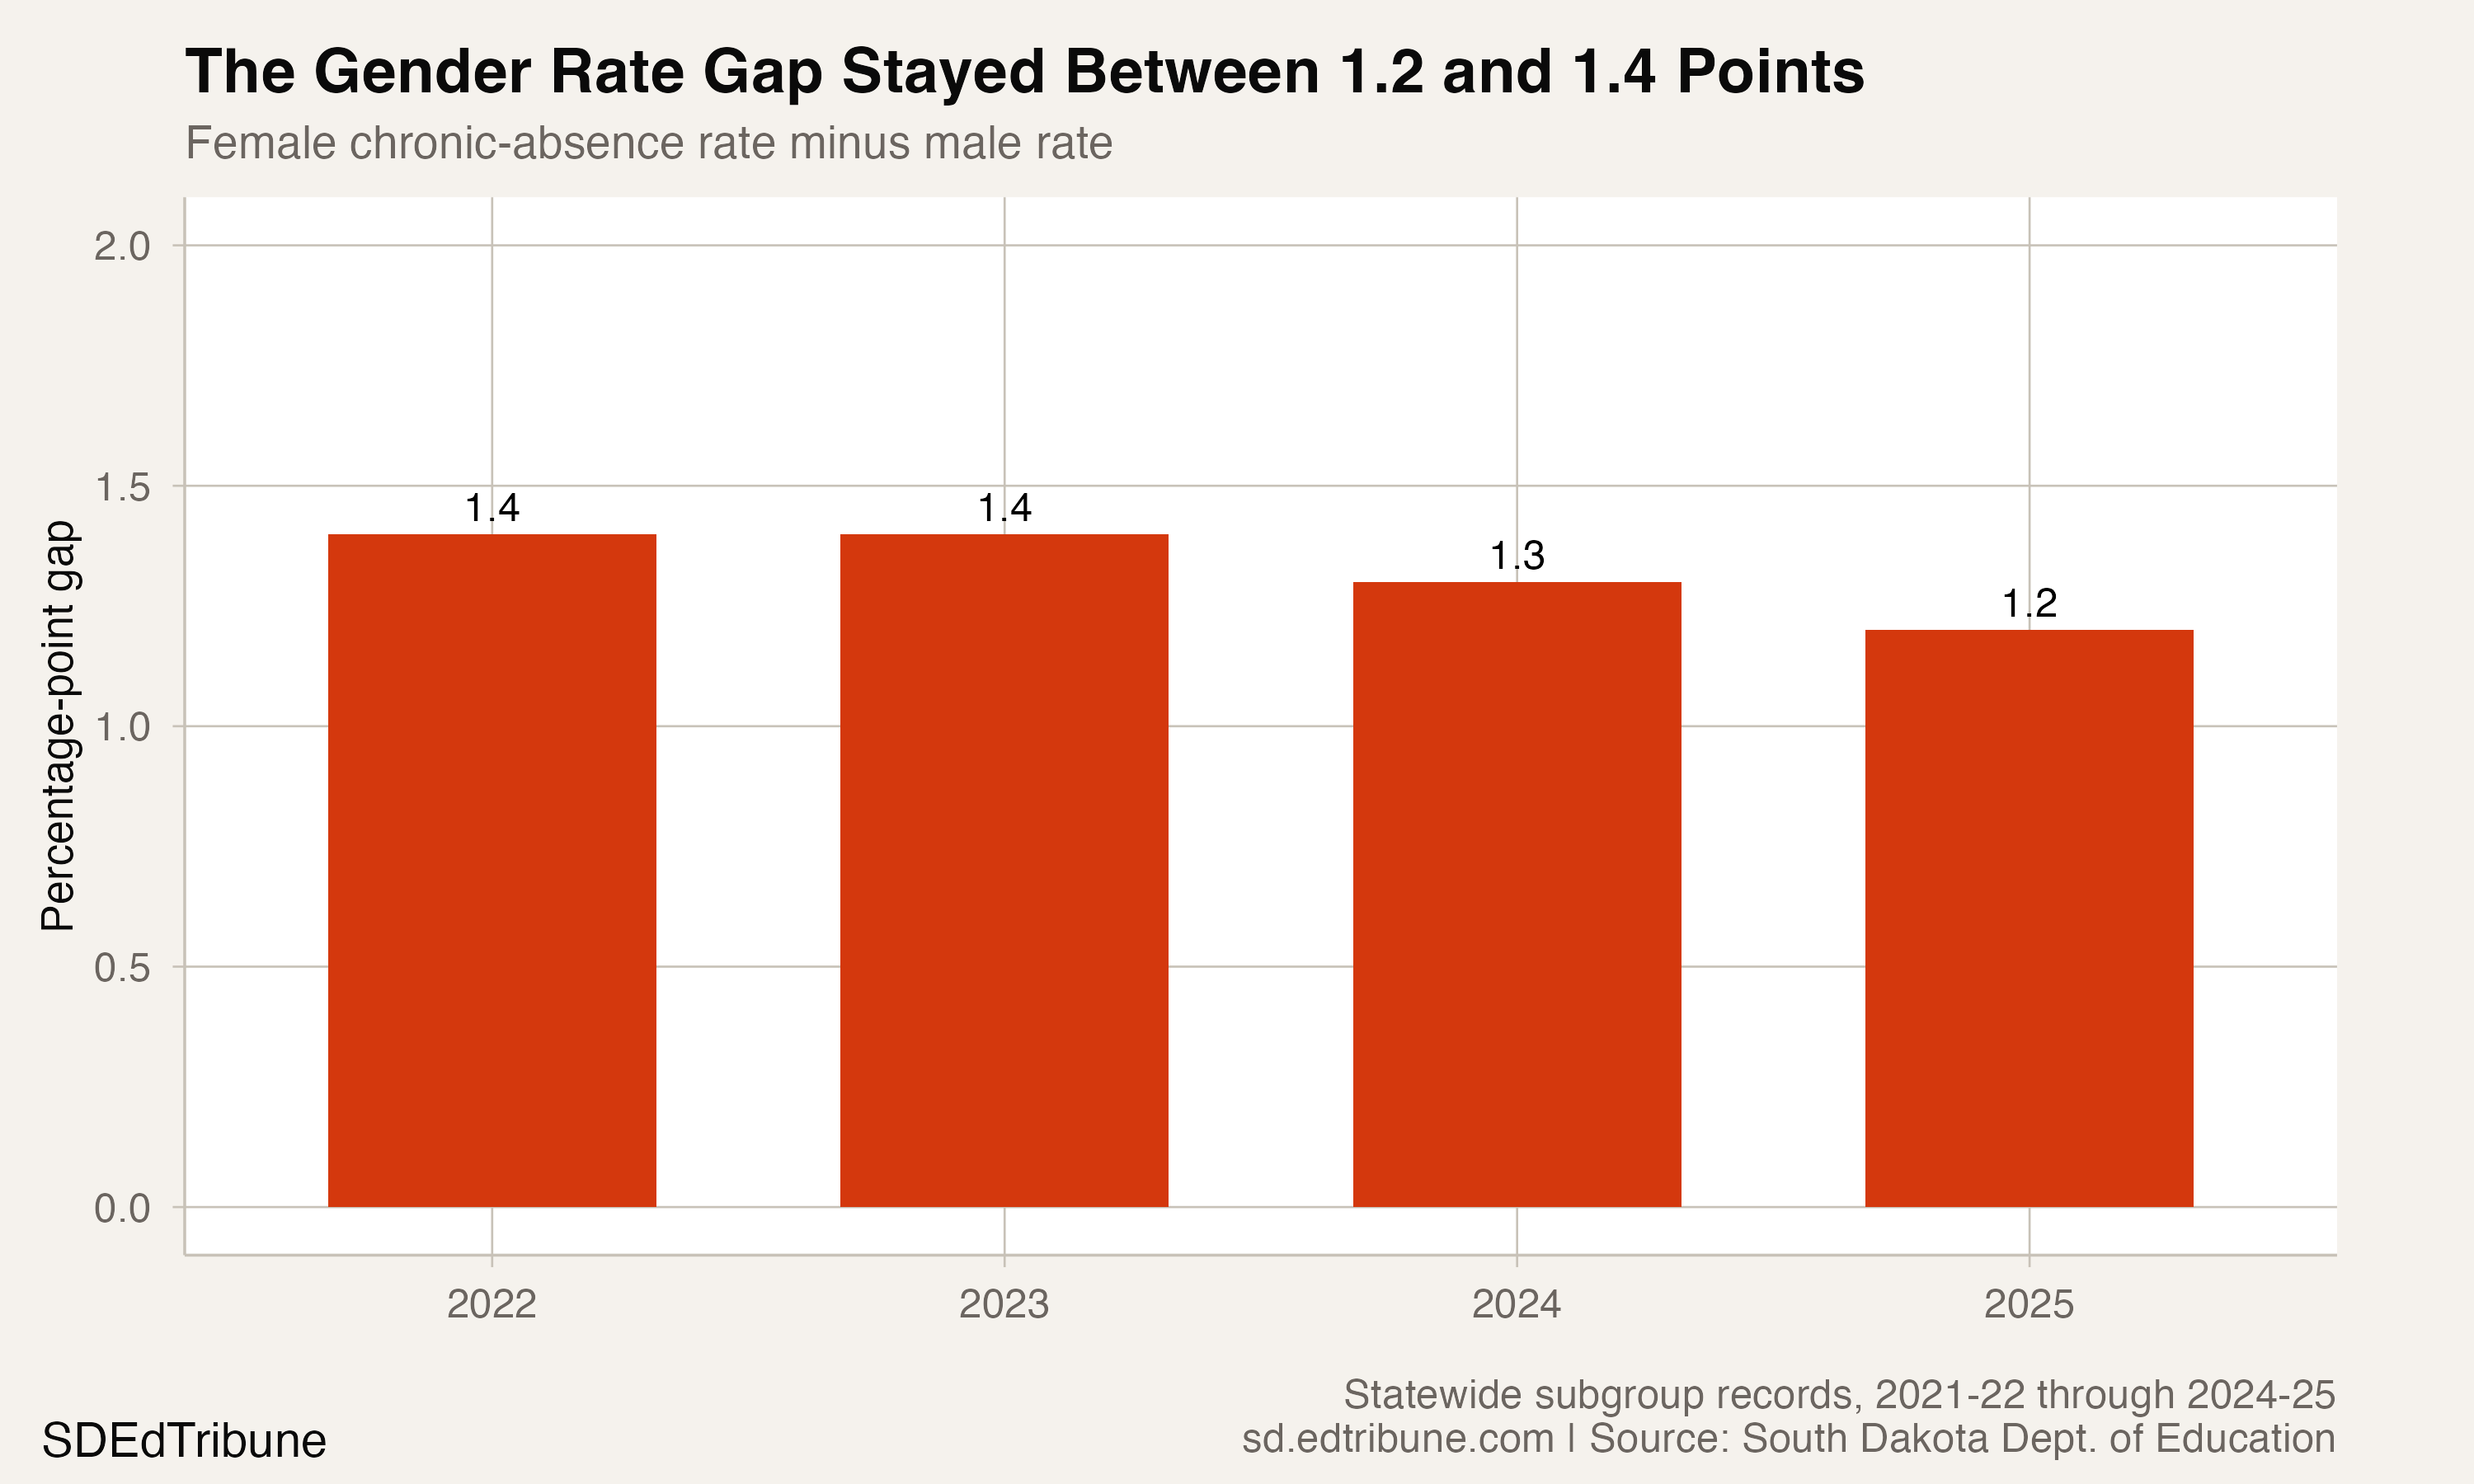
The female-minus-male gap was 1.4 points in both 2022 and 2023, then 1.3 points in 2024 and 1.2 points in 2025. The difference narrowed slightly, but it did not close.
The latest counts show why rates and totals answer different questions. In 2025, 14,804 female students and 14,811 male students were chronically absent—nearly identical totals. But those counts came from denominators of 70,873 and 75,060, respectively, producing the different rates.
South Dakota's 2025 accountability manual defines its female and male subgroups using gender as of May 1. The public aggregates establish the rate pattern but do not explain why it exists.
The disability-status gap reversed in 2025
Students with disabilities had chronic-absence rates of 23.5% in 2022, 22.7% in 2023 and 22.1% in 2024. Their gap with the all-students rate narrowed from 1.9 to 1.6 to 1.3 percentage points across those years.
The direction changed in 2025. The students-with-disabilities rate rose to 23.3% while the statewide rate fell to 20.3%, widening the gap to 3.0 points.
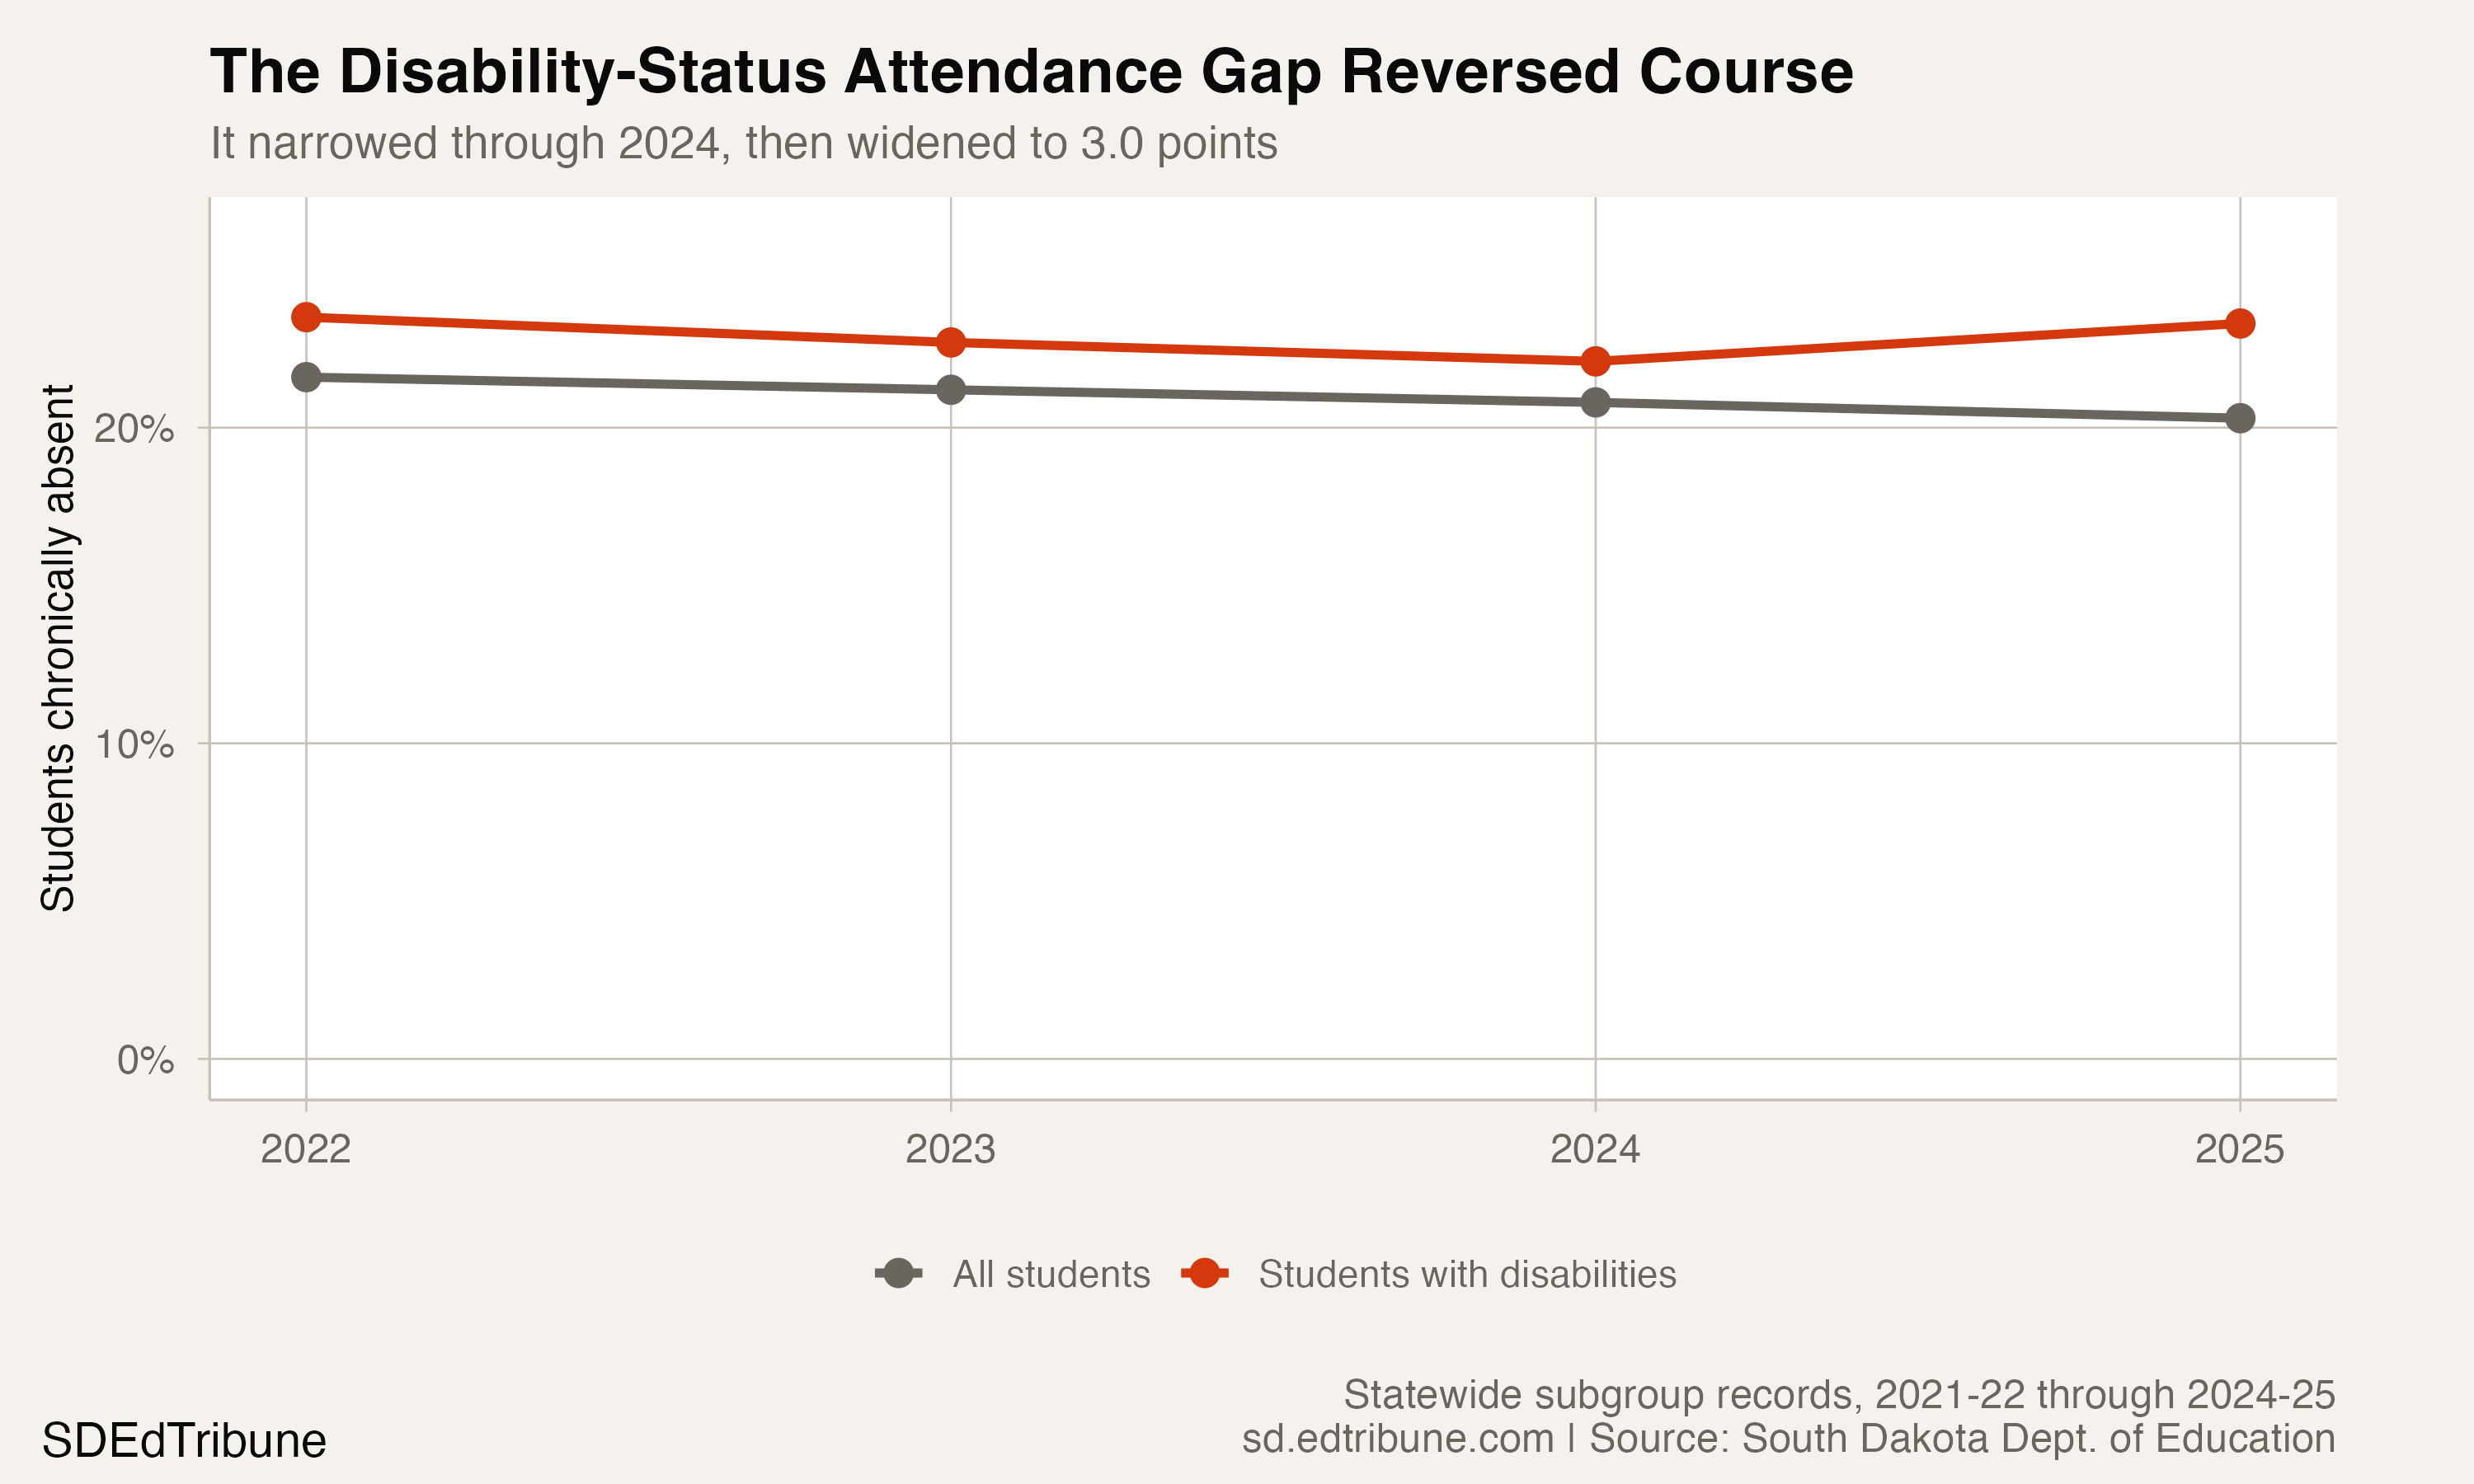
The underlying population also changed sharply. From 2024 to 2025, the reported students-with-disabilities denominator grew by 4,765, or 22.1%, to 26,364. Its chronic count grew by 1,370, or 28.7%, to 6,150. Because the count grew faster than the denominator, the rate increased by 1.2 points.
The state manual defines this subgroup by special-education status as of May 1. That rule makes classification and composition important context for a one-year denominator shift. The aggregate records cannot determine whether reporting, identification, services, health, community conditions or some combination drove the change.
This analysis uses South Dakota Department of Education statewide chronic-absence records for 2022 through 2025. The department publishes the files and documentation on its annual Report Card page.
Detailed code that reproduces the analysis and figures in this article is available exclusively to EdTribune subscribers.
Discussion
Sign in to join the discussion.
Loading comments...