In 2007-08, Hispanic students made up 2.7% of South Dakota's public school enrollment. One in 37 students. A rounding error in a state where white students held an 81.9% supermajority and Native American students were the only sizable minority group.
Seventeen years later, that rounding error is 12,845 students, 9.3% of enrollment, and growing faster than any other demographic group in the state. The gap between Hispanic and Native American enrollment, once 11,198 students, has narrowed to 1,438. If the longer-term trajectory holds, Hispanic students could surpass Native American students as the state's second-largest racial group within the next decade, though a sharp deceleration in the most recent year complicates that projection.
From 3,279 to 12,845
The raw numbers tell a story of acceleration. Hispanic enrollment grew 291.7% between 2007-08 and 2024-25, adding 9,566 students to South Dakota classrooms. No other racial or ethnic group comes close to that growth rate over the same period.
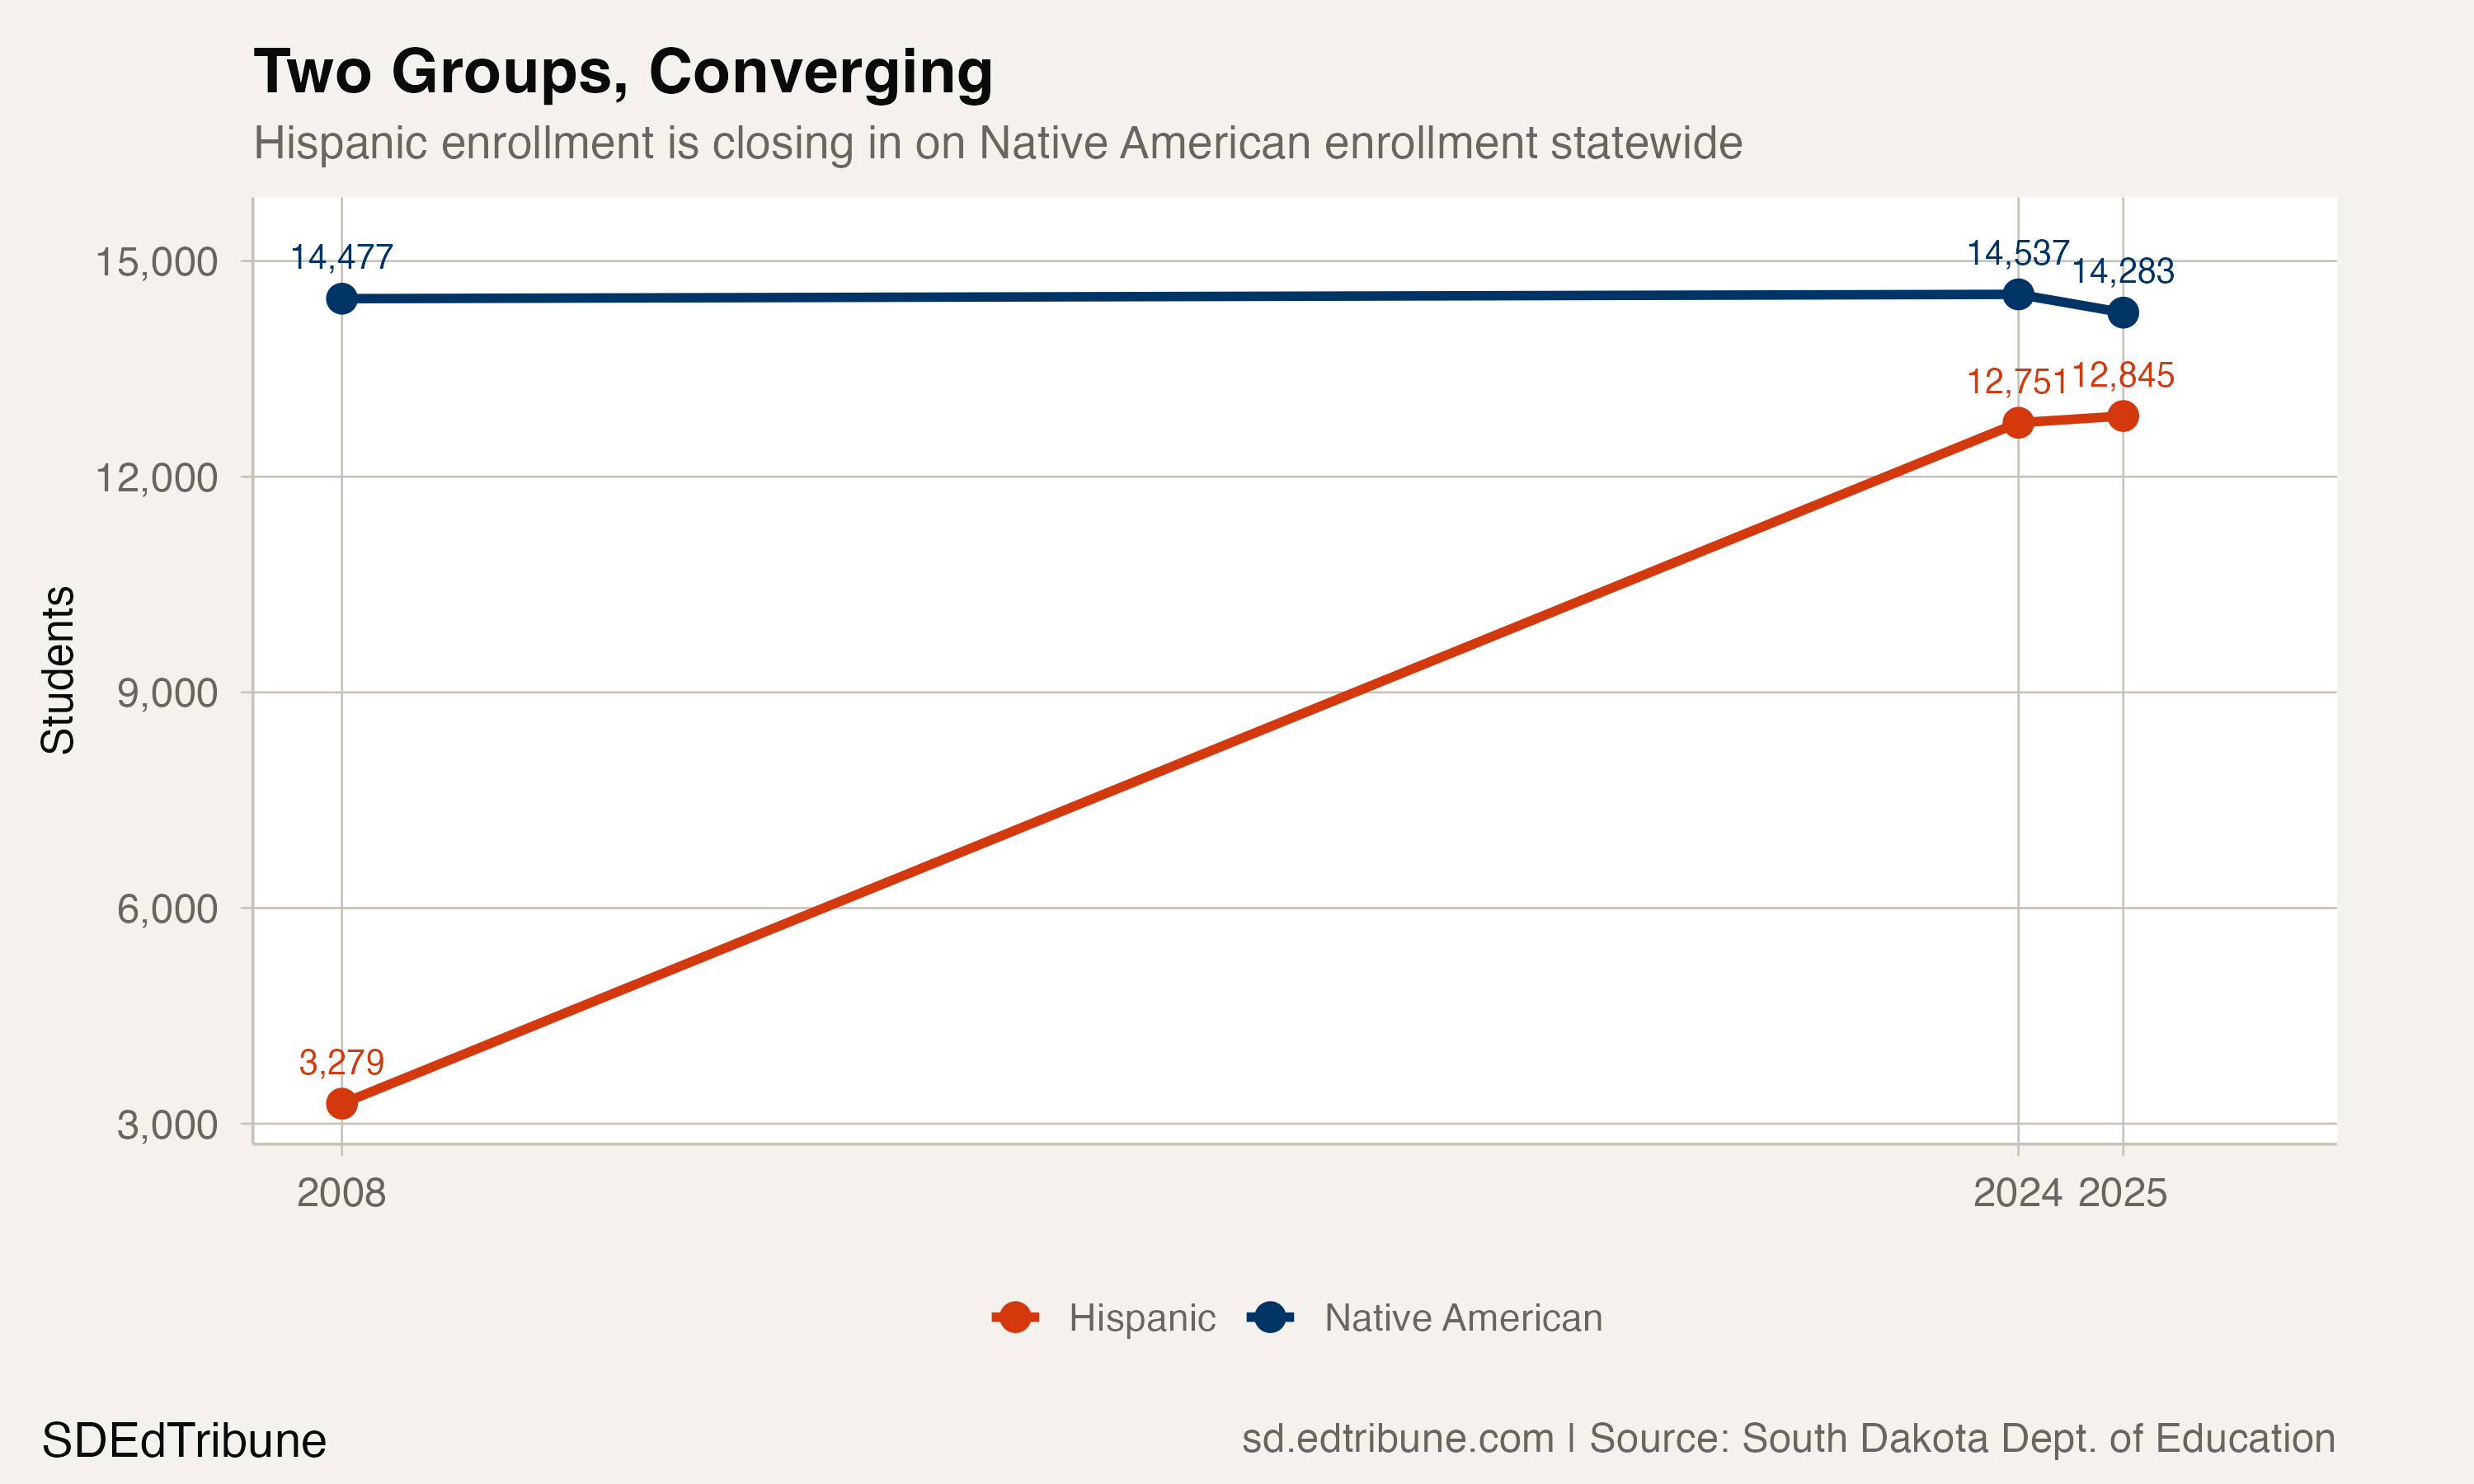
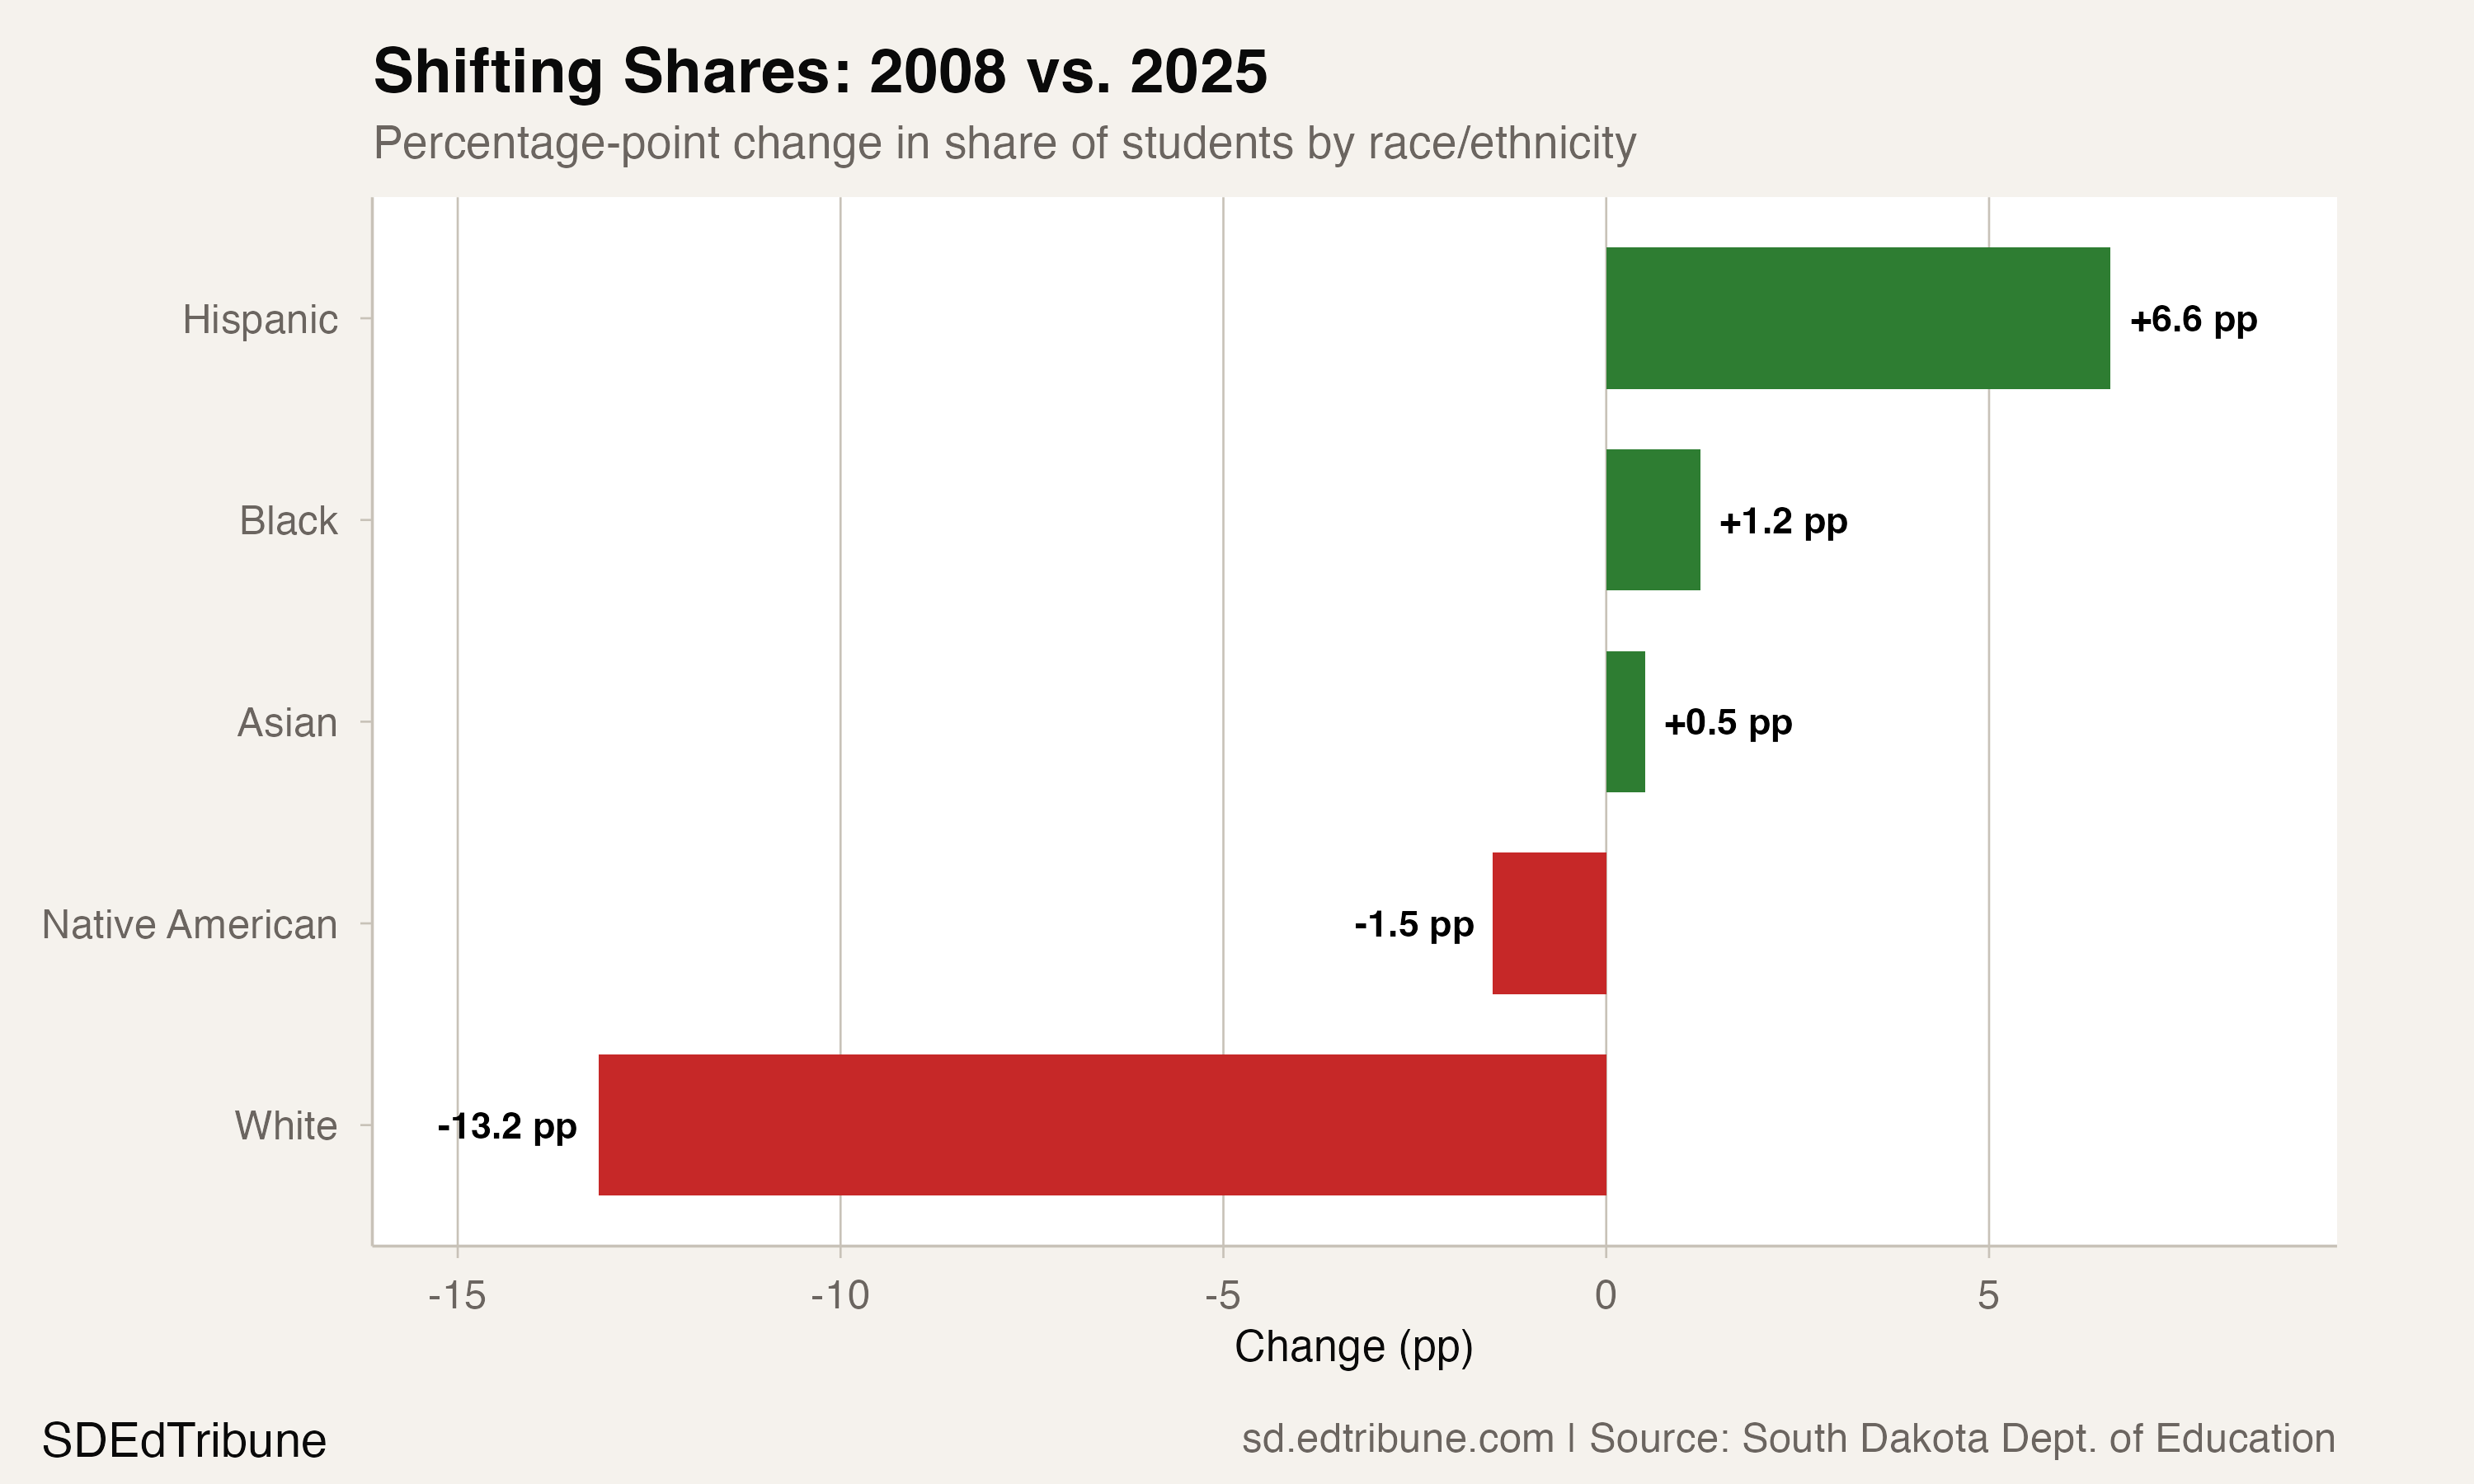
Native American enrollment has been essentially flat, moving from 14,477 in 2007-08 to 14,283 in 2024-25. White enrollment fell by 5,275 students over the same span, a 5.2% decline that looks modest in percentage terms but obscures a more significant shift: white students' share of enrollment dropped from 81.9% to 68.7%, a 13.2 percentage-point decline.
Hispanic students absorbed much of that shift, gaining 6.6 percentage points of share. Black students, Asian students, and multiracial students also grew their shares, but none by more than 1.2 points.
A note on the data: South Dakota's race/ethnicity enrollment records are available only at the campus level and only for 2007-08 through 2009-10 and 2021-22 through 2024-25. A 10-year gap from 2010-11 through 2020-21 means these two eras cannot be connected with a continuous trendline. The growth described here compares endpoints across that gap.
The Turkey Plant That Saved a Town
The geographic concentration of Hispanic enrollment growth follows the food processing industry. Of the 9,566 Hispanic students added statewide since 2007-08, Sioux Falls↗ET accounted for 2,894, roughly 30% of all growth. But the transformation is most visible in Huron↗ET, a city of about 13,000 halfway between Sioux Falls and Pierre.
In 2007-08, Huron's schools were 80.2% white and 9.7% Hispanic. By 2024-25, white students had dropped to 38.3% and Hispanic students had risen to 35.0%. Asian students, many of them children of Karen refugees from Myanmar, grew from 3.9% to 20.1%. Huron went from a nearly homogeneous district to one where no racial group holds a majority.
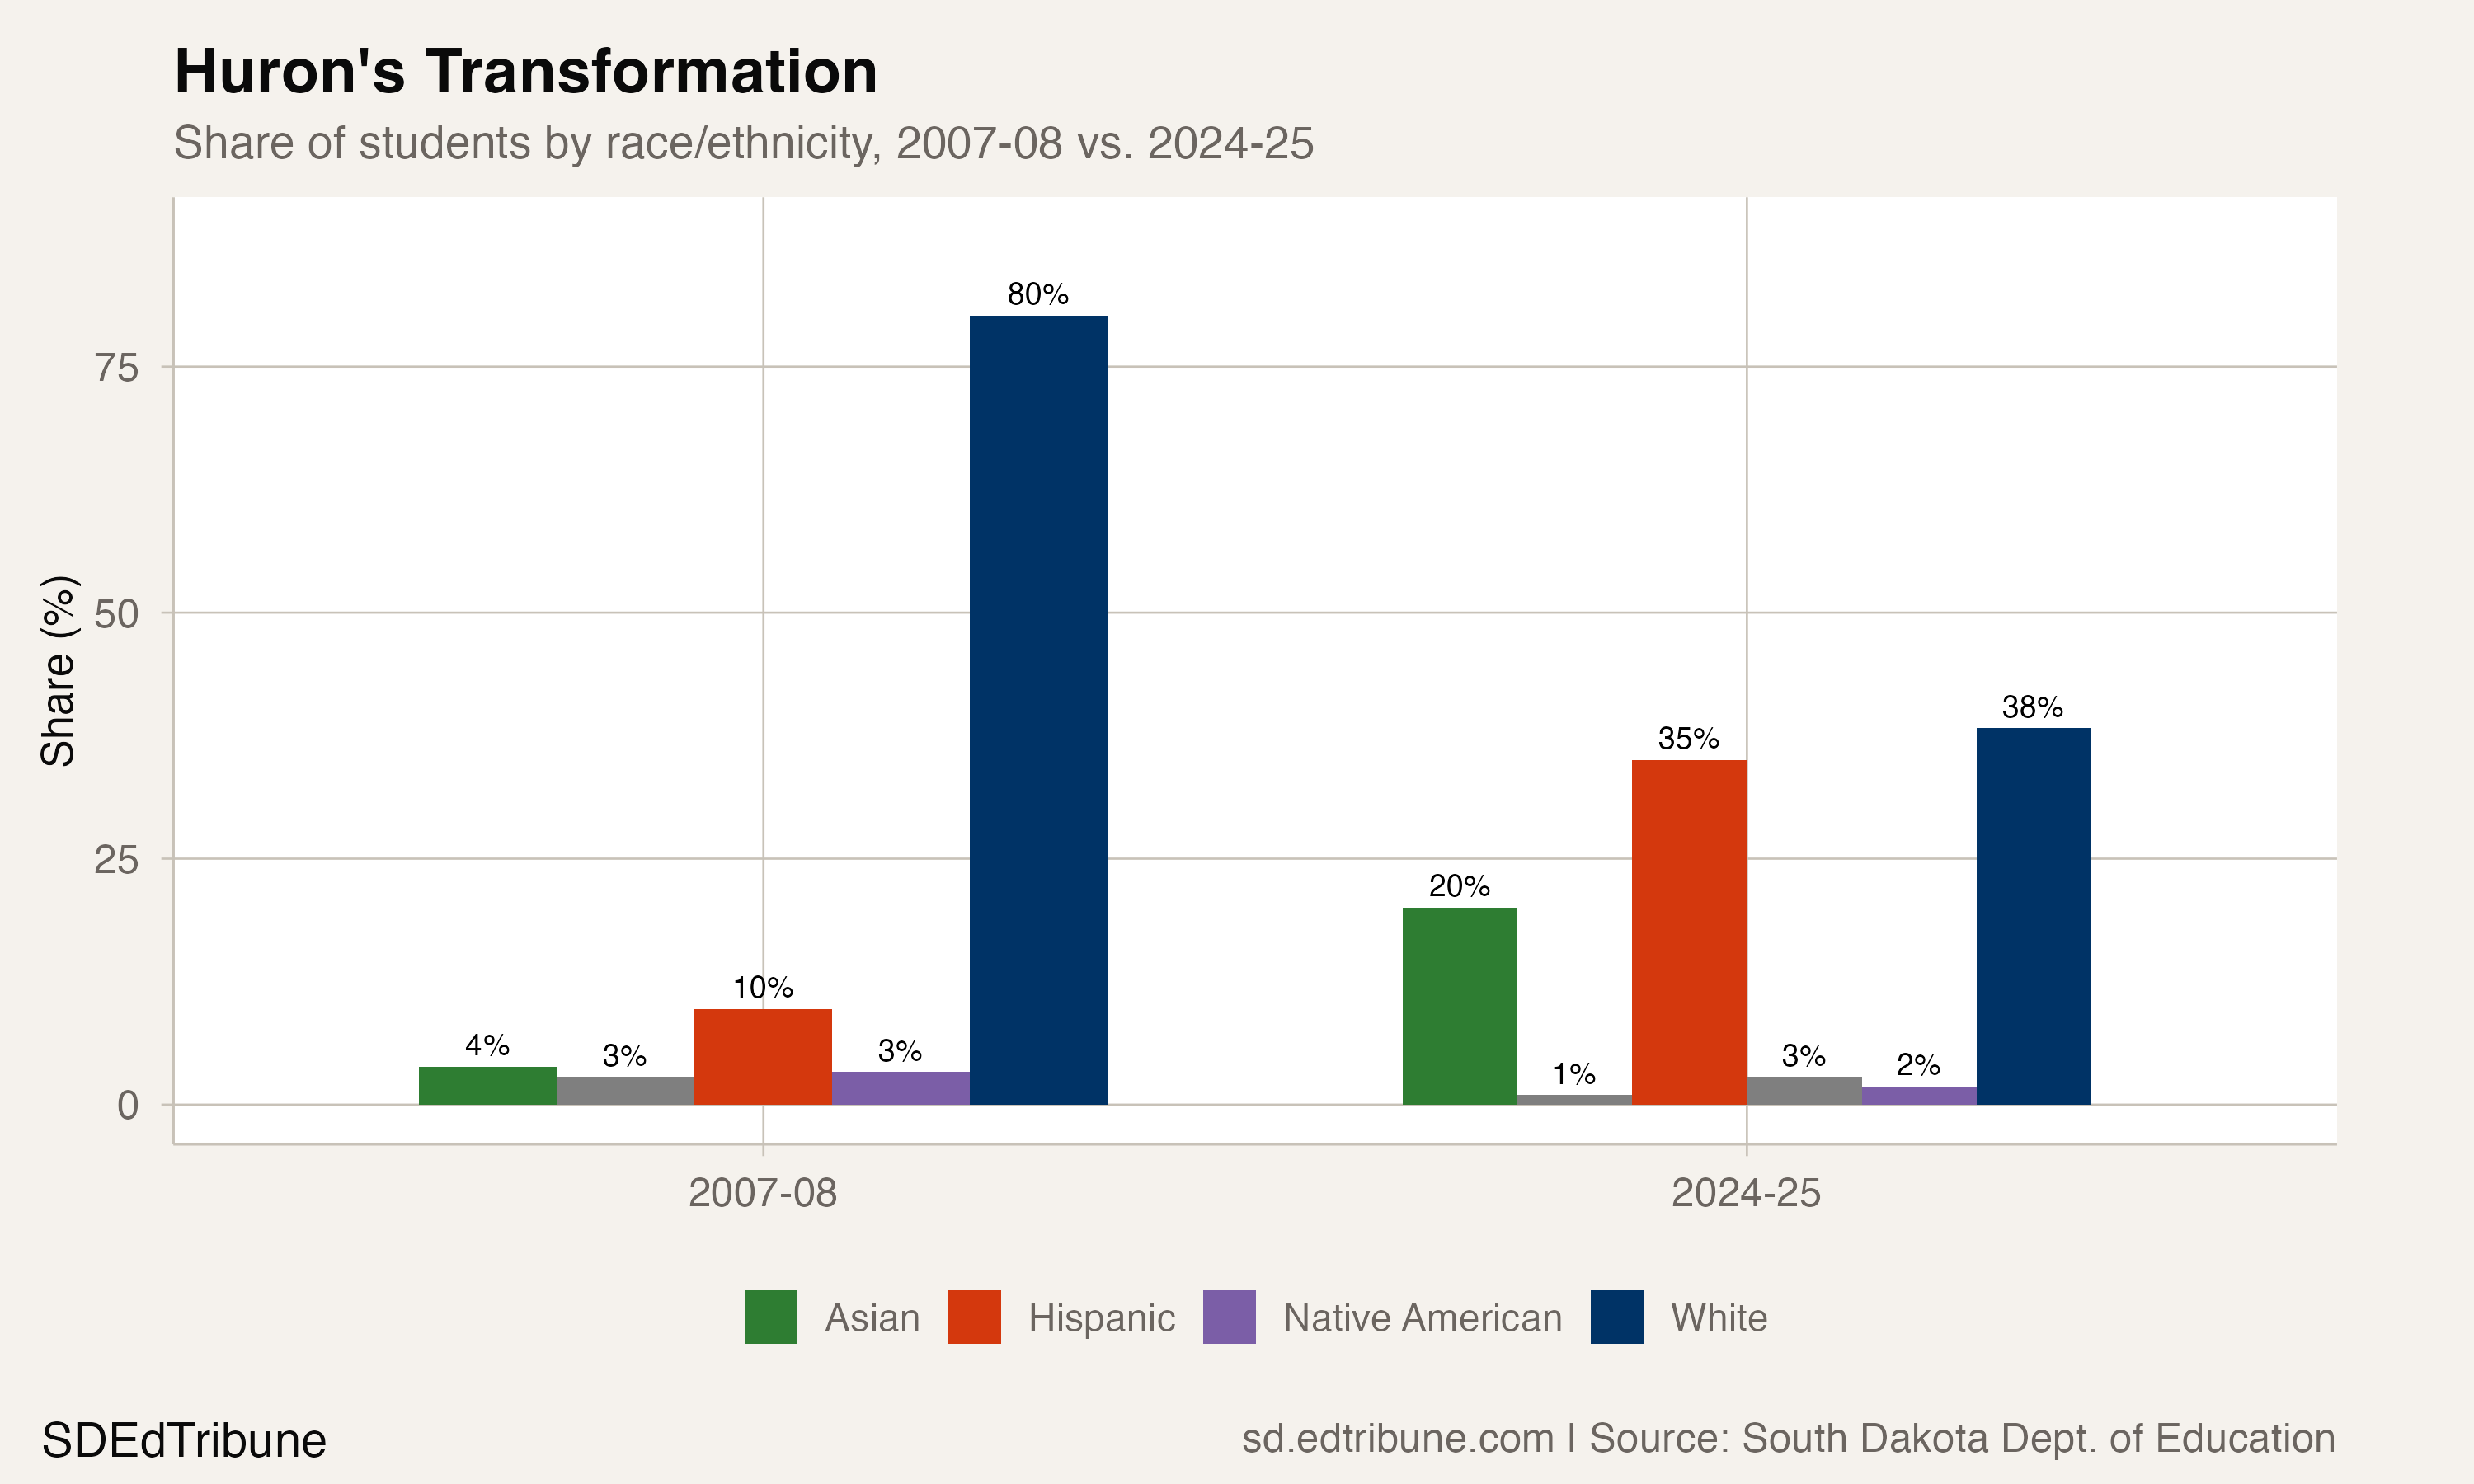
The catalyst was Dakota Provisions, a turkey processing plant that opened in 2005 after 44 Hutterite colonies pooled resources to build it. The plant now processes 20,000 turkeys daily with roughly 1,000 workers. About 16% of its workforce is from Latin America. More than 600 Karen workers, recruited starting in 2007, make up the largest single group.
"Without the Karen people, we probably would not be able to run the turkey plant." — Mark Heuston, HR Director, Dakota Provisions, PBS News Weekend
The plant's arrival reversed a demographic collapse. Huron's school enrollment had fallen from 2,400 students in 1994 to 1,800 seven years later as major employers closed or relocated. By 2024-25, the district enrolled 3,042 students with race data. The workforce brought families, and the families brought children.
Chain Migration and the Meatpacking Corridor
The pattern is not unique to Huron. Across rural South Dakota, food processing jobs have created pockets of rapid Hispanic growth in communities that had been losing population for decades.
Weiwei Zhang, a South Dakota State University professor and state demographer, has described the mechanism as self-reinforcing. "A few family members find employment in the community, and then more relatives move there through chain migration," Zhang told South Dakota News Watch.
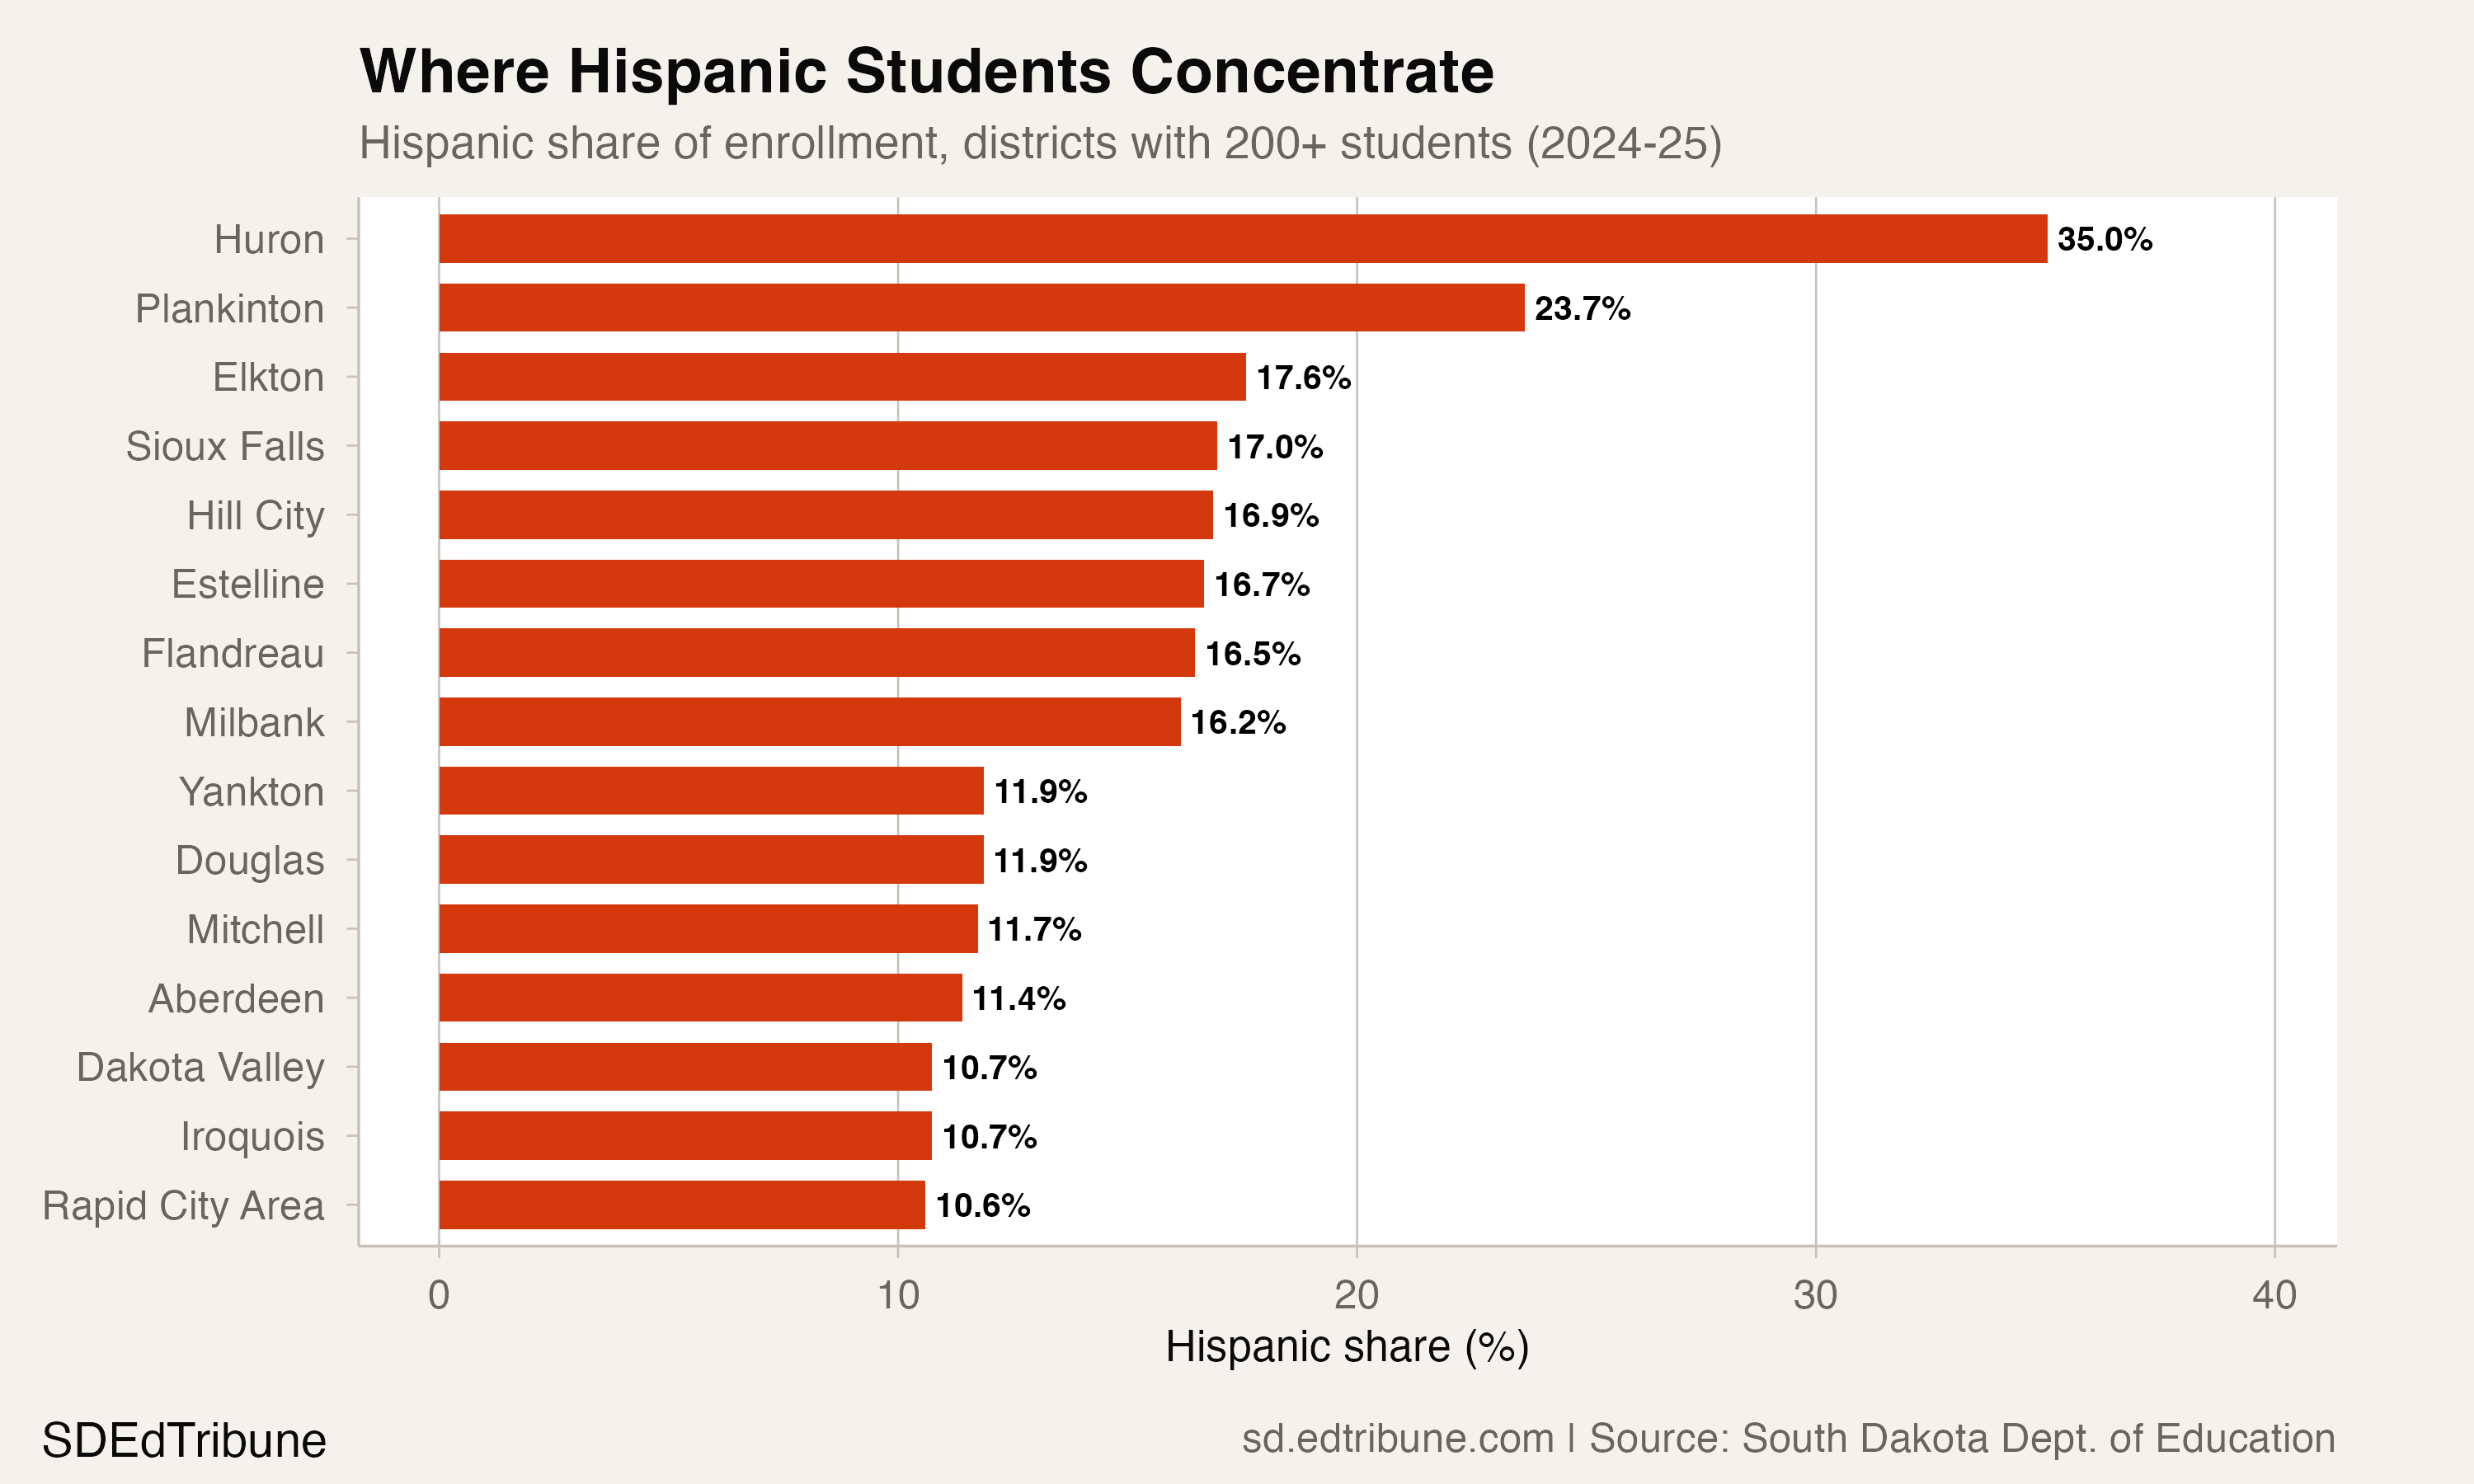
Aberdeen↗ET's schools illustrate the pattern. Hispanic enrollment there grew from 46 students (1.2% of the district) in 2007-08 to 471 (11.4%) in 2024-25, a 923.9% increase. Mitchell↗ET went from 58 to 303. Yankton↗ET from 97 to 353. Milbank↗ET from 32 to 163. In all, 20 districts now have Hispanic enrollment above 10%, and 57 are above 5%.
Daniel Lichter, a Cornell University sociologist who earned his sociology degree from SDSU, has called Hispanic immigration to rural communities a "demographic lifeline" for places that would otherwise continue to shrink. The statewide Hispanic population more than doubled from 22,119 (2.7%) in the 2010 census to an estimated 44,581 (4.9%) by 2022. Mexico and Guatemala are the most common countries of origin for foreign-born South Dakota residents, with an estimated 3,626 and 2,932 residents respectively as of 2023.
Sioux Falls: Scale and Speed
In absolute terms, Sioux Falls is the center of Hispanic enrollment growth. The district added 2,894 Hispanic students between 2007-08 and 2024-25, growing from 1,319 (6.2% of enrollment) to 4,213 (17.0%). Hispanic students are now the district's second-largest racial group, ahead of Black students (3,339, or 13.4%) and behind white students (13,445, or 54.1%).
The district's ELL infrastructure reflects that growth. Students speak more than 91 languages in their homes across the district, and the Hispanic share of enrollment jumped from 11.4% to 12.6% in a single year as far back as 2019, a pace the district's superintendent at the time called "a new reality" rather than a temporary trend. The distinction between immigration-driven enrollment and the enrollment of U.S.-born children whose families arrived years earlier matters here: available data suggests over half of ELL students in the district were born in the United States.
South Dakota's foreign-born population grew 45.5% between 2010 and 2022, roughly three times the national rate. But the school enrollment data suggests much of the Hispanic growth in classrooms comes not from recent arrivals but from the children of families who arrived in the previous decade, as the community stabilizes and expands through natural increase and secondary migration from other states.
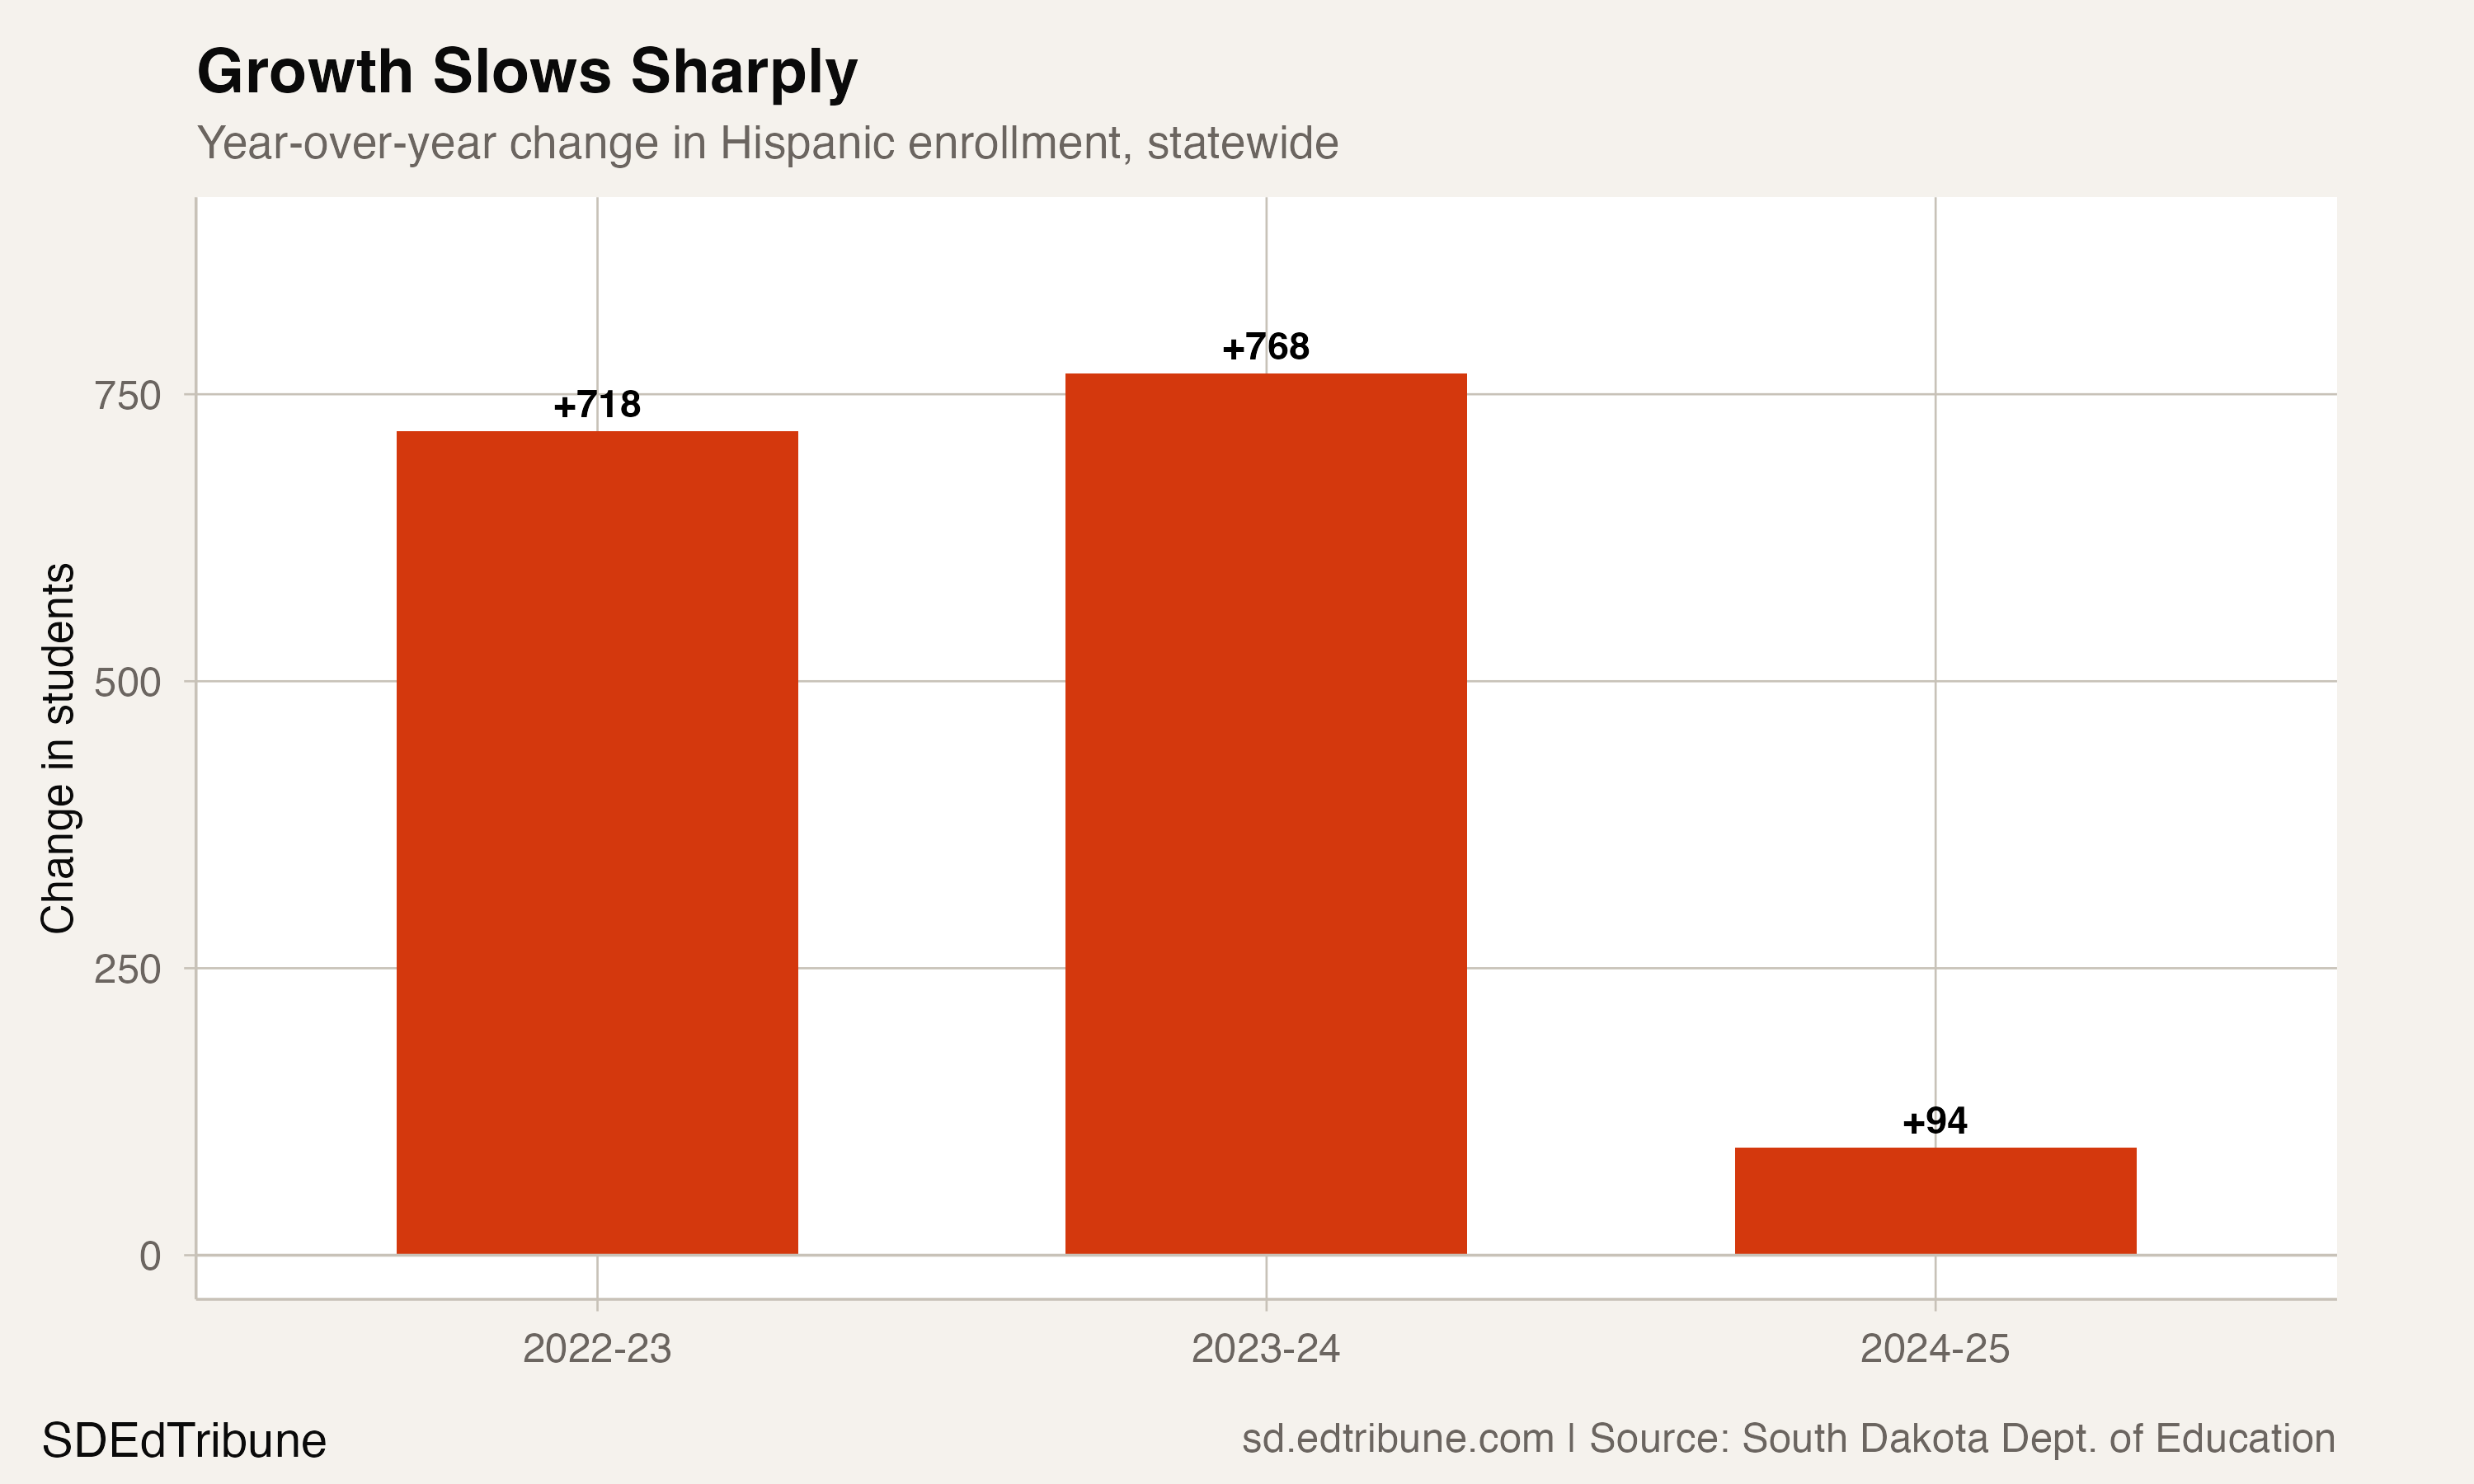
A Deceleration Worth Watching
The most recent data carries a warning. After adding 718 Hispanic students in 2022-23 and 768 in 2023-24, the statewide gain dropped to 94 in 2024-25, an 88% slowdown.
One year does not make a trend, and the data cannot distinguish between a true slowdown in Hispanic population growth and year-to-year variation in when families enroll. Federal immigration enforcement changes under the current administration may also be a factor. Refugee arrivals to South Dakota declined in 2025 after a spike in 2024, and Lutheran Social Services, the state's primary resettlement agency, has seen its federal support reduced. Whether those policy shifts affect Hispanic enrollment specifically is unclear; refugee resettlement in South Dakota has primarily involved Somali, Congolese, and Burmese populations rather than Latin American ones.
The demographic math, however, favors continued growth. Nationally, the Hispanic median age is 23.4 for males compared to 40.4 for white males, meaning the Hispanic population skews heavily toward childbearing and school age. Even if new arrivals slow, the children already enrolled will move through the system, and the families already in place will continue to have children.
Huron rebuilt its entire school system around multilingual education, hiring a certified ESL instructor for every grade. It had 20 years of lead time and a single employer whose survival depended on making the transition work. Aberdeen, Mitchell, and Yankton are adding Hispanic students at double-digit rates without that runway. They are hiring ESL staff into systems designed for monolingual classrooms, in a state that spends zero dollars on bilingual teacher preparation at its public universities. The gap between Huron's model and what most districts are actually doing will show up in achievement data long before it shows up in enrollment figures.
Detailed code that reproduces the analysis and figures in this article is available exclusively to EdTribune subscribers.
Discussion
Sign in to join the discussion.
Loading comments...